


Mito Pro Panel
An advanced, forward-looking workup for staying ahead of the risks that build quietly over decades.
Consider this test if:
- You want a broad annual baseline across metabolism, heart, kidney, liver, and blood
- Fatigue, brain fog, poor sleep, or sluggish recovery you are trying to explain
- Tracking whether diet, training, or a new supplement is moving your numbers
- Family history of heart disease or diabetes and you want routine wide-angle screening
- It has been a year or more since your last full set of labs
Choose an option to continue
- HSA/FSA eligible
- Results delivered to your dashboard · Reviewed by a real clinician
Blood draw at 3,300+ lab locations nationwide
Pre-test considerations
Fasting for 9 to 12 hours is recommended because the panel includes glucose and lipid markers that shift after eating; water and prescribed medications are fine. Morning draws are preferable, especially if any hormone markers are included, since several follow a daily rhythm. Note any supplements you take and keep the routine consistent between tests so results stay comparable.

Video consult with your Care Team
A 1:1 call to discuss your health.
What members say on Trustpilot
What this test is for
The Mito Pro Panel is built for getting ahead of the risks that build quietly over decades. It is a wide, advanced workup: a full cardiovascular read that goes past standard cholesterol to NMR lipoprotein particles, Apo B, Lp(a), and your omega-3 and omega-6 balance, a heavy-metals screen for arsenic, lead, and mercury, IGF-1 as a marker of growth and aging, a kidney measure using cystatin C, and a full thyroid panel with TPO antibodies. It also covers the sex and stress hormones, complete iron and B-vitamin status, metabolism and blood sugar with insulin, and a complete blood count. It is the panel to run when the basics look fine but you want to understand the finer signals behind heart, metabolic, and long-term health, and to set a detailed baseline you can track over time.
Biomarkers tested
Heart Health
ApoB counts the actual number of atherogenic particles (LDL, VLDL, and their remnants) circulating in your blood, since each one carries exactly one ApoB molecule on its surface. It's a more accurate readout of cardiovascular risk than LDL cholesterol, because LDL-C measures the cholesterol cargo inside those particles but misses how many particles are actually out there depositing it into artery walls. Testing it matters for anyone building a baseline on heart disease risk, tracking response to diet or statin therapy, or with a family history of early cardiovascular events despite a normal-looking LDL.
- Specimen
- Serum or plasma
- Measures
- Mass concentration
- Specimen
- Whole blood
- Measures
- Ratio
- Specimen
- Whole blood
- Measures
- Mass fraction (%)
- Specimen
- Whole blood
- Measures
- Mass fraction (%)
- Specimen
- Serum or plasma
- Measures
- Ratio
- Specimen
- Whole blood
- Measures
- Mass fraction (%)
- Specimen
- Whole blood
- Measures
- Mass fraction (%)
- Specimen
- Whole blood
- Measures
- Mass fraction (%)
- Specimen
- Whole blood
- Measures
- Mass fraction (%)
- Specimen
- Whole blood
- Measures
- Interpretation
- Specimen
- Whole blood
- Measures
- Ratio
HDL cholesterol measures the fraction of cholesterol carried by particles that pull excess cholesterol out of artery walls and ferry it back to the liver for disposal, a process called reverse cholesterol transport. Low HDL removes less cholesterol from circulation and tracks with higher cardiovascular risk, often alongside high triglycerides, excess visceral fat, insulin resistance, or a sedentary lifestyle. Checking it alongside ApoB and triglycerides gives a fuller risk picture than total cholesterol alone, and it's a useful marker for tracking how exercise, weight loss, or alcohol reduction shift your lipid profile over time.
- Specimen
- Serum or plasma
- Measures
- Mass concentration
Large HDL particles measure the biggest, most buoyant subclass of HDL, the ones most efficient at pulling cholesterol out of artery walls and carrying it back to the liver for disposal. A high count generally tracks with better cardiovascular protection and often rises with aerobic exercise, weight loss, and moderate alcohol intake, while a low count despite normal total HDL can mean your HDL isn't doing its job well. This is most useful alongside ApoB and Lp(a) for people building a fuller picture of cardiovascular risk, or for tracking whether training and diet changes are actually improving your lipid profile rather than just moving the total HDL number.
- Specimen
- Serum or plasma
- Measures
- Substance concentration
Large VLDL particles are the biggest, triglyceride-stuffed carriers your liver ships out when it's dealing with excess calories, insulin resistance, or a high-carb, high-fat load. A high count signals your liver is overproducing fat-rich particles, often the earliest lipid clue of metabolic syndrome, fatty liver, or prediabetes, well before standard cholesterol panels look abnormal. If you're tracking how diet, weight loss, or reduced alcohol and sugar intake are reshaping your metabolism, this number moves fast and gives you a real-time read on that progress.
- Specimen
- Serum or plasma
- Measures
- Substance concentration
LDL cholesterol refers to the cholesterol carried by LDL particles, the ones that lodge in artery walls and seed plaque. High LDL is the classic driver of atherosclerosis and a core input for cardiovascular risk, useful as a baseline and for tracking response to diet, exercise, or statin therapy. Because it's calculated rather than directly measured, it loses accuracy when triglycerides run high, which is when a direct LDL or ApoB test tells you more.
- Specimen
- Serum or plasma
- Method
- Calculated
- Measures
- Mass concentration
LDL particle number counts the actual number of LDL particles circulating in your blood, not just the cholesterol packed inside them. Each particle can lodge in an artery wall and seed plaque, so particle count often predicts cardiovascular risk more precisely than LDL cholesterol, especially when the two disagree (a common pattern with insulin resistance, high triglycerides, or metabolic syndrome). Test it to get a real baseline on atherogenic risk or to see whether diet, exercise, or medication changes are actually lowering the number of particles driving plaque, not just the cholesterol they carry.“}
- Specimen
- Serum or plasma
- Measures
- Substance concentration
LDL particle pattern classifies your LDL into Pattern A (larger, buoyant particles) or Pattern B (small, dense particles that slip into artery walls more easily and oxidize faster). Two people with identical LDL cholesterol can carry very different cardiovascular risk depending on which pattern dominates, which matters if you have a strong family history of heart disease, high triglycerides, or insulin resistance. It pairs well with ApoB and a lipid panel to clarify whether your cholesterol number is telling the whole story or hiding a riskier particle profile underneath.
- Specimen
- Serum or plasma
- Measures
- Identity
This measures the average size of your LDL particles, not just how much LDL you're carrying. Smaller, dense LDL particles slip into artery walls more easily and oxidize faster, driving plaque formation, while larger, buoyant particles are comparatively less harmful, so two people with identical LDL cholesterol can carry very different cardiovascular risk. Pair it with ApoB and Lp(a) to see whether your cardiovascular risk is being underestimated by standard cholesterol testing, or track it as you change diet, carbs, or training to see your particle profile shift toward the less atherogenic pattern.
- Specimen
- Serum or plasma
- Measures
- Length (per cell)
- Specimen
- Whole blood
- Measures
- Mass fraction (%)
- Specimen
- Serum or plasma
- Measures
- Length (per cell)
- Specimen
- Serum
- Measures
- Substance concentration
- Specimen
- Serum or plasma
- Measures
- Length (per cell)
Lipoprotein(a), or Lp(a), is a particle built onto LDL that carries extra plaque-forming and clotting potential, and unlike most cholesterol markers, it's set almost entirely by genetics rather than diet or exercise. High Lp(a) raises cardiovascular risk independent of LDL or ApoB, which is why it matters most for people with early heart disease in the family or unexplained cardiovascular events despite normal cholesterol. Because it's largely inherited, one test usually tells you your lifetime number, making it a check-once marker that reshapes how aggressively you manage everything else.
- Specimen
- Serum or plasma
- Measures
- Substance concentration
Non-HDL cholesterol is total cholesterol minus HDL, which leaves every artery-clogging particle behind: LDL, VLDL, and their remnants. It correlates closely with ApoB and often predicts cardiovascular risk better than LDL alone, especially when triglycerides run high or LDL looks deceptively normal. Useful as a baseline cardiovascular risk marker, for tracking response to diet or statin therapy, or for making sense of a lipid panel that doesn't quite add up.
- Specimen
- Serum or plasma
- Measures
- Mass concentration
Small LDL particles measures the dense, cholesterol-poor LDL subtype that slips into artery walls more easily and lingers longer than large, buoyant LDL. Elevated levels often appear alongside high triglycerides, low HDL, and insulin resistance, a pattern common with metabolic syndrome, prediabetes, or a diet high in refined carbs, and one that standard LDL cholesterol can completely miss. Testing this is useful for anyone with a strong cardiovascular family history, borderline LDL but nagging risk factors, or a need to see whether carb reduction, weight loss, or exercise is actually shifting particle quality, not just particle count.
- Specimen
- Serum or plasma
- Measures
- Substance concentration
Total cholesterol adds up everything your blood carries: LDL, HDL, and a fraction of your triglycerides. It's a decent starting snapshot but a blunt one, since it can't tell you whether the load is mostly protective HDL or the LDL particles that drive plaque, which is why it's best read alongside ApoB or an LDL/HDL breakdown rather than on its own. Useful as a baseline cardiovascular check or to track how diet, weight change, or medication are shifting your lipid picture over time.
- Specimen
- Serum or plasma
- Measures
- Mass concentration
Triglycerides measure the fat circulating in your blood after your body packages up unused calories, mostly from carbs and alcohol, for storage. High levels signal that your liver is overwhelmed with fuel it can't burn, a pattern common with excess sugar, alcohol, weight gain, or insulin resistance, and one that drives cardiovascular risk independent of LDL. Pair it with fasting insulin and HDL to see the full metabolic picture, and track it when you cut sugar, alcohol, or refined carbs to see if the intervention is actually working.
- Specimen
- Serum or plasma
- Measures
- Mass concentration
VLDL cholesterol tracks the cholesterol packed into VLDL particles, the fat-and-triglyceride carriers your liver ships out to deliver energy to tissues. This value is calculated (typically triglycerides divided by 5), so it rises whenever triglycerides run high, flagging excess liver fat production often tied to insulin resistance, weight gain, alcohol intake, or a high-sugar diet. Elevated VLDL adds to your atherogenic particle burden alongside LDL, making it useful context for cardiovascular risk and for tracking how diet, exercise, or metabolic treatment are moving your triglycerides over time.
- Specimen
- Serum or plasma
- Method
- Calculated
- Measures
- Mass concentration
Hormonal Health
AMH is produced by small ovarian follicles and reflects the size of your remaining egg supply, not egg quality or whether you're fertile right now. It's used to plan the timing of fertility treatment, predict how your ovaries will respond to stimulation during IVF, and flag conditions like PCOS (high AMH) or diminished ovarian reserve (low AMH). Testing it gives you a real number for a question that age alone can't answer: how much reproductive runway you have left.
- Specimen
- Serum or plasma
- Measures
- Mass concentration
Cortisol is the hormone your adrenal glands release to manage stress, blood sugar, blood pressure, and your wake-sleep rhythm, peaking in the morning and tapering through the day. High levels can point to chronic stress, Cushing's syndrome, or overtraining, while low levels suggest adrenal insufficiency (Addison's disease) or a pituitary problem, either of which can drive fatigue, weight changes, poor sleep, low blood pressure, and brain fog. Testing it establishes a baseline for how your body handles stress and helps investigate unexplained exhaustion, mood swings, or a sleep-wake cycle that feels out of sync, especially when paired with ACTH or DHEA-S for fuller context.
- Specimen
- Serum or plasma
- Measures
- Mass concentration
DHEA-S is made almost entirely by the adrenal glands and serves as a stable reservoir your body converts into testosterone and estrogen as needed, making it a reliable read on adrenal androgen output since it doesn't fluctuate hour to hour like cortisol. Low levels can accompany fatigue, low libido, reduced muscle mass, and mood changes, and often show up with adrenal insufficiency or normal age-related decline, while high levels point toward PCOS or an adrenal disorder and often come with acne, excess hair growth, or irregular cycles. It's a useful baseline for tracking adrenal and hormonal aging over time, and a key piece alongside testosterone and cortisol when investigating unexplained fatigue or hormonal symptoms.
- Specimen
- Serum or plasma
- Measures
- Mass concentration
Estradiol is the dominant estrogen, produced mainly by the ovaries, and it governs the menstrual cycle, builds the uterine lining, supports bone density, and helps regulate mood and sleep. In women, this test tracks ovarian reserve and cycle phase, monitors fertility treatment, or investigates irregular periods, hot flashes, night sweats, low libido, or mood shifts around perimenopause and menopause. In men, estradiol is made from testosterone and, when elevated, can drive gynecomastia, low libido, or mood changes, so it's often checked alongside testosterone when those symptoms show up or when starting hormone therapy.
- Specimen
- Serum or plasma
- Measures
- Mass concentration
Free T3 measures the unbound, active form of triiodothyronine, the thyroid hormone that actually enters cells to drive metabolic rate, heart rate, and body temperature. It matters most when TSH is abnormal or borderline, since Free T3 confirms whether the thyroid is truly overactive or underactive, or whether the body is failing to convert T4 into usable T3. Low levels track with fatigue, weight gain, cold intolerance, and brain fog, while high levels point to anxiety, palpitations, heat intolerance, and unintended weight loss.
- Specimen
- Serum or plasma
- Measures
- Mass concentration
Free T4 measures the unbound thyroxine circulating in blood, the active thyroid hormone available for cells to pull in and convert into T3, which drives your metabolic rate, body temperature, and energy production. Low free T4 points to an underactive thyroid and pairs with fatigue, weight gain, cold intolerance, constipation, and brain fog, while high free T4 suggests hyperthyroidism and tracks with anxiety, racing heart, weight loss, and heat intolerance. Run it alongside TSH to see whether the pituitary and thyroid are communicating properly, which clarifies whether a TSH abnormality reflects true thyroid dysfunction or something upstream.
- Specimen
- Serum or plasma
- Measures
- Mass concentration
Free testosterone is the small unbound fraction, roughly 1-2% of total testosterone, that's actually available to enter cells and act on muscle, brain, bone, and libido. Total testosterone can look normal while free testosterone runs low if sex hormone binding globulin is high, so this is the number that best explains low libido, fatigue, poor recovery, mood flatness, or difficulty building muscle despite training hard. It's also the marker to track if you're on testosterone therapy or optimizing training and body composition, since it reflects the hormone your tissues actually see, not just what's circulating in reserve.
- Specimen
- Serum or plasma
- Measures
- Mass concentration
FSH is the pituitary signal that drives egg maturation in the ovaries and sperm production in the testes. In women, rising FSH reflects declining ovarian reserve, making it central to fertility planning, cycle irregularity workups, and confirming perimenopause or menopause. In men, elevated FSH points to impaired sperm production, while low levels in either sex suggest the pituitary or hypothalamus isn't sending the signal at all, useful context alongside LH and estradiol.
- Specimen
- Serum or plasma
- Measures
- Concentration
IGF-1 is the messenger growth hormone sends out to do its work, built mainly in the liver and responsible for building muscle, repairing tissue, and supporting bone density. Because it stays stable in the blood while growth hormone itself spikes and vanishes within minutes, IGF-1 is the reliable proxy for your growth hormone status, useful for tracking recovery, muscle retention, and training response over time. Low levels show up as poor recovery, muscle loss, fatigue, or weak bone density, while high levels warrant a closer look at pituitary function.
- Specimen
- Serum or plasma
- Measures
- Mass concentration
LH is the pituitary signal that triggers ovulation in women and drives testosterone production in the testes of men, acting as the messenger between brain and gonads. In women, tracking LH alongside FSH and estradiol clarifies where you are in your cycle, confirms ovulation timing for fertility planning, and helps investigate irregular periods or suspected PCOS. In men, a low LH with low testosterone points to a signaling problem upstream in the pituitary, while a high LH with low testosterone points to testicular failure, a distinction that changes how low libido, fatigue, or muscle loss get treated.
- Specimen
- Serum or plasma
- Measures
- Concentration
Prolactin is made by the pituitary gland and its main job outside of pregnancy and lactation is to signal, so elevated levels suppress the reproductive hormones that drive libido, ovulation, and testosterone production. High prolactin shows up as irregular or missing periods, unexplained milk production, low libido, erectile dysfunction, or fertility difficulty, and can stem from certain medications, thyroid problems, stress, or a pituitary adenoma. If you're investigating a stalled cycle, unexplained galactorrhea, low libido, or working through a fertility workup with estradiol, FSH, and LH, prolactin tells you whether this hormone is the one crowding out the others.
- Specimen
- Serum or plasma
- Measures
- Mass concentration
SHBG is a liver-made protein that binds testosterone and estradiol, controlling how much hormone is free to act on tissue rather than locked up in transit. High SHBG (common with high estrogen, hyperthyroidism, or liver disease) can leave you hormonally starved even when total testosterone looks normal, while low SHBG (seen with insulin resistance, obesity, or hypothyroidism) inflates free hormone activity. Pairing SHBG with total testosterone gives you an actual free testosterone picture, useful for investigating low libido, fatigue, mood changes, or irregular cycles, and for tracking how weight loss or metabolic changes are shifting your hormone availability over time.
- Specimen
- Serum or plasma
- Measures
- Substance concentration
- Specimen
- Serum or plasma
- Measures
- Concentration
Total testosterone measures the hormone your testes (or ovaries and adrenal glands in women) produce to drive libido, muscle mass, bone density, energy, and mood. Low levels show up as fatigue, low sex drive, harder recovery from training, mood changes, and difficulty building or keeping muscle, while high levels in women can signal PCOS or point to an androgen-secreting source. It is the standard baseline for anyone tracking hormonal health with age, evaluating symptoms, or checking response to training, weight loss, or testosterone therapy.
- Specimen
- Serum or plasma
- Measures
- Mass concentration
TSH is the pituitary's messenger to the thyroid, signaling it to produce more or less thyroid hormone based on what your body needs. This ultrasensitive assay (detection limit under 0.005 mIU/L) picks up even mildly suppressed levels, making it the sharpest tool for confirming hyperthyroidism and distinguishing it from a normal-low result. It's the marker to check when fatigue pairs with weight change, heat or cold intolerance, anxiety, racing heart, hair thinning, or irregular cycles, and it's just as useful as a baseline or for tracking thyroid medication dosing over time.
- Specimen
- Serum or plasma
- Method
- High-sensitivity assay
- Measures
- Concentration
Blood Health
- Specimen
- Whole blood
- Method
- Light microscopy
- Measures
- Presence / threshold
- Specimen
- Whole blood
- Method
- Light microscopy
- Measures
- Presence / threshold
Band neutrophils are immature neutrophils released early from the bone marrow when the body needs backup fast, still finishing their development while already heading out to fight infection. A normal count means the marrow isn't under pressure. An elevated count, often called a left shift, signals an active bacterial infection, inflammation, or significant physical stress and often shows up alongside fever, fatigue, or a suspected infection that needs to be tracked down.
- Specimen
- Whole blood
- Method
- Automated cell count
- Measures
- Number concentration
- Specimen
- Whole blood
- Method
- Automated cell count
- Measures
- Number concentration
- Specimen
- Whole blood
- Method
- Automated cell count
- Measures
- Number fraction (%)
Blasts are immature precursor cells that normally stay in the bone marrow, maturing before they enter circulation. Finding them in blood is abnormal at any meaningful number and points toward a bone marrow disorder, most seriously leukemia, where the marrow releases these unfinished cells before they are ready to defend, clear, or carry anything properly. This test is used diagnostically, alongside a full blood count and clinical picture, when something else (unexplained fatigue, bruising, infections, abnormal counts) has already raised concern.
- Specimen
- Whole blood
- Measures
- Number concentration
- Specimen
- Whole blood
- Method
- Manual cell count
- Measures
- Number fraction (%)
Elliptocytes are red blood cells shaped like ellipses instead of the usual disc, spotted when a lab technician examines your blood smear under a light microscope. A few can appear normally, but a significant number points to a membrane defect, most often hereditary elliptocytosis, or to iron deficiency, thalassemia, or other bone marrow disorders that disrupt how red cells are built. This test is typically ordered to investigate unexplained anemia, fatigue, or abnormal red cell counts, helping pin down why your red blood cells aren't holding their normal shape.
- Specimen
- Whole blood
- Method
- Light microscopy
- Measures
- Presence / threshold
- Specimen
- Whole blood
- Method
- Automated cell count
- Measures
- Number concentration
- Specimen
- Whole blood
- Method
- Automated cell count
- Measures
- Number fraction (%)
- Specimen
- Whole blood
- Method
- Automated cell count
- Measures
- Distribution width
- Specimen
- Whole blood
- Method
- Automated cell count
- Measures
- Number concentration
Granulocytes, mostly neutrophils with smaller numbers of eosinophils and basophils, are the white cells that rush to sites of infection or injury and attack bacteria and other invaders. This manual count reports what fraction of your white cells are granulocytes, useful for confirming automated counts and getting an accurate read when cell populations look unusual under the microscope. A result outside the expected range points toward active infection, inflammation, or a bone marrow issue and is typically read alongside your full white cell differential rather than on its own.
- Specimen
- Whole blood
- Method
- Manual cell count
- Measures
- Number fraction (%)
Hematocrit measures the percentage of your blood volume made up of red blood cells, the cells that carry oxygen from your lungs to every tissue. Low hematocrit points to anemia and pairs with fatigue, breathlessness, dizziness, or poor exercise tolerance, while high hematocrit can reflect dehydration, high altitude, smoking, or overactive red cell production, and thickens blood in ways that matter for cardiovascular risk. It's a core piece of the complete blood count, useful as a baseline read on oxygen-carrying capacity and for tracking how iron status, training, or altitude exposure are shifting your blood over time.
- Specimen
- Whole blood
- Method
- Automated cell count
- Measures
- Volume fraction (%)
- Specimen
- Whole blood
- Method
- Light microscopy
- Measures
- Presence / threshold
Immature granulocytes are young neutrophils, eosinophils, and basophils that bone marrow releases early when it's ramping up production, cells that haven't fully matured before entering circulation. A raised percentage signals the marrow is working overtime, most often because of an active bacterial infection, inflammation, or physiological stress, and it tends to rise before other markers catch up, making it a fast early flag when you're feeling unwell with fever, fatigue, or signs of infection. For proactive tracking, a normal result alongside a routine CBC confirms your marrow isn't under acute strain.
- Specimen
- Whole blood
- Measures
- Number fraction (%)
Large granular lymphocytes are the natural killer cells and cytotoxic T cells that patrol the blood, hunting down virus-infected cells and abnormal cells before they become a problem. This count is rarely ordered as routine screening, it's typically pulled when a full blood count or clinical picture suggests LGL leukemia or a related chronic lymphoproliferative disorder, especially alongside unexplained neutropenia, anemia, or recurrent infections. An elevated count warrants follow-up with flow cytometry to characterize the cell population and confirm what's driving the expansion.
- Specimen
- Whole blood
- Measures
- Number concentration
- Specimen
- Whole blood
- Method
- Automated cell count
- Measures
- Number concentration
- Specimen
- Whole blood
- Method
- Automated cell count
- Measures
- Number concentration
- Specimen
- Whole blood
- Method
- Automated cell count
- Measures
- Number fraction (%)
- Specimen
- Whole blood
- Method
- Light microscopy
- Measures
- Presence / threshold
Mean platelet volume measures the average size of your platelets, the cell fragments that plug injured vessels and stop bleeding. Larger platelets are younger, freshly released from bone marrow, and more reactive, so a high MPV often signals increased platelet turnover from inflammation, iron deficiency, or clotting risk, while a low MPV points to reduced marrow production or older, less active platelets. Paired with your platelet count, MPV helps distinguish why a platelet number is off and adds useful context if you're investigating easy bruising, unexplained clotting, or inflammatory conditions.
- Specimen
- Whole blood
- Method
- Automated cell count
- Measures
- Mean cell volume
Megakaryocytic nuclei are a manual smear finding that flags when the bone marrow cells responsible for producing platelets show up in circulating blood, where they don't belong. Their presence signals marrow stress or a disorder pushing immature cells out early, and it's typically picked up when a blood smear is reviewed to investigate abnormal platelet counts, unexplained bleeding or clotting, or other irregularities on a CBC. This isn't a routine wellness check, it's a targeted microscopy finding your doctor orders to chase down what a standard blood count can't explain.
- Specimen
- Whole blood
- Method
- Light microscopy
- Measures
- Presence / threshold
- Specimen
- Whole blood
- Method
- Manual cell count
- Measures
- Number fraction (%)
- Specimen
- Whole blood
- Method
- Light microscopy
- Measures
- Presence / threshold
- Specimen
- Whole blood
- Method
- Automated cell count
- Measures
- Number concentration
Mononuclear cells are the lymphocytes and monocytes in your differential, the cells that recognize threats, produce antibodies, and clean up debris and dying tissue. This manual count expresses them as a fraction of total white cells, useful for confirming automated differential results or getting an accurate read when abnormal or immature cells make automated counting unreliable. A shifted mononuclear fraction shows up in viral infections, chronic inflammation, and certain blood disorders, and helps explain fatigue, swollen lymph nodes, or a white count that doesn't add up.
- Specimen
- Whole blood
- Method
- Manual cell count
- Measures
- Number fraction (%)
- Specimen
- Whole blood
- Method
- Manual cell count
- Measures
- Number fraction (%)
- Specimen
- Whole blood
- Method
- Manual cell count
- Measures
- Number fraction (%)
- Specimen
- Whole blood
- Method
- Light microscopy
- Measures
- Presence / threshold
- Specimen
- Whole blood
- Method
- Manual cell count
- Measures
- Number concentration
This manual count compares nucleated red blood cells to white blood cells, giving the lab a precise ratio used to correct your white blood cell count when immature red cells are present in circulation. Nucleated RBCs normally stay locked in the bone marrow until they mature and shed their nucleus, so finding them in blood signals the marrow is under stress, pushed out early by severe anemia, hemolysis, bone marrow disorders, or low oxygen states. This isn't a standalone wellness check, it's a technical follow-up your lab runs to keep your white cell count accurate whenever nucleated RBCs turn up on a differential.
- Specimen
- Whole blood
- Method
- Manual cell count
- Measures
- Ratio
- Specimen
- Red blood cells
- Method
- Automated cell count
- Measures
- Mean cell volume
This is a catch-all flag from your automated blood count, capturing unusual cells that don't sort cleanly into the standard white cell categories (neutrophils, lymphocytes, monocytes, eosinophils, basophils). A nonzero result doesn't diagnose anything on its own, it tells the lab's analyzer that something atypical, like blasts, abnormal lymphocytes, or other irregular cells, showed up and usually triggers a manual review under the microscope. If you're already investigating unexplained fatigue, bruising, infections, or a suspicious complete blood count, this value tells you whether a closer look is warranted.
- Specimen
- Whole blood
- Method
- Automated cell count
- Measures
- Number concentration
This captures white blood cells that fall outside the standard five-type differential (neutrophils, lymphocytes, monocytes, eosinophils, basophils), typically immature or atypical cells that an automated analyzer flags but can't cleanly classify. A nonzero count usually prompts a manual smear review to identify what's actually circulating, since it can reflect anything from a reactive response to infection to something that warrants closer hematology follow-up. This isn't a marker people track for wellness purposes, it's a quality flag your lab uses to decide whether your blood needs a closer look.
- Specimen
- Whole blood
- Method
- Automated cell count
- Measures
- Number concentration
- Specimen
- Whole blood
- Method
- Light microscopy
- Measures
- Presence / threshold
This test examines a blood smear under the microscope for parasites that invade red blood cells, most notably the organisms that cause malaria, babesiosis, and related infections. It's the standard workup when someone develops fevers, chills, sweats, fatigue, or a recent travel history to a malaria-endemic region raises suspicion of a blood-borne parasite. A positive result identifies the organism directly, which guides urgent treatment, while a negative result helps rule out parasitic infection as the cause of unexplained fever.
- Specimen
- Whole blood
- Method
- Light microscopy
- Measures
- Identity
Platelet count estimates how many clotting cells circulate in your blood, the fragments that rush to a cut or vessel injury and clump together to form a plug. Low counts (thrombocytopenia) show up as easy bruising, frequent nosebleeds, gum bleeding, or heavy periods, and can stem from bone marrow issues, autoimmune destruction, viral infection, or spleen problems. High counts can signal inflammation, iron deficiency, or a bone marrow disorder pushing out too many, so this is a useful baseline check as well as a first step in explaining unusual bleeding or bruising.
- Specimen
- Whole blood
- Method
- Estimated
- Measures
- Number concentration
- Specimen
- Whole blood
- Method
- Automated cell count
- Measures
- Number concentration
- Specimen
- Whole blood
- Method
- Light microscopy
- Measures
- Presence / threshold
Polychromasia is what a technologist sees under the microscope when young red blood cells, still tinted blue-grey from residual RNA, show up in your blood smear. Their presence tells you the bone marrow is releasing cells faster than usual, typically because it's compensating for blood loss or hemolysis (red cells being destroyed early), or responding to iron, B12, or folate treatment. It's a useful confirmation alongside reticulocyte count when investigating unexplained anemia, fatigue, or pallor, and it helps distinguish a marrow actively regenerating from one that's underproducing.
- Specimen
- Whole blood
- Method
- Light microscopy
- Measures
- Presence / threshold
- Specimen
- Whole blood
- Method
- Manual cell count
- Measures
- Number fraction (%)
- Specimen
- Whole blood
- Method
- Manual cell count
- Measures
- Number fraction (%)
- Specimen
- Whole blood
- Method
- Light microscopy
- Measures
- Presence / threshold
- Specimen
- Whole blood
- Method
- Light microscopy
- Measures
- Presence / threshold
Siderocytes are red blood cells caught holding onto free iron granules instead of packaging that iron properly into hemoglobin, and this count reflects how well your bone marrow handles iron during red cell production. Elevated siderocytes point to impaired iron utilization, seen in sideroblastic anemias, lead exposure, certain myelodysplastic conditions, or after splenectomy (since the spleen normally clears these iron remnants from circulation). This is a specialized follow-up test, not a routine screen: it's ordered when a CBC or iron panel shows an unexplained anemia pattern that needs a closer look at how iron is actually being handled inside developing red cells.
- Specimen
- Whole blood
- Measures
- Number concentration
- Specimen
- Whole blood
- Method
- Light microscopy
- Measures
- Presence / threshold
Stomatocytes are red blood cells that carry a mouth-shaped slit across their surface instead of the usual central dot, a shape change that shows up when a technologist examines your blood smear under the microscope. Their presence points to conditions that disrupt the cell membrane's balance of sodium and potassium, including hereditary stomatocytosis, liver disease, and heavy alcohol use, and can also appear as an artifact of sample handling. This test is typically ordered to help explain unexplained anemia or hemolysis rather than for routine baseline screening, and it works alongside a CBC and reticulocyte count to pin down the cause.
- Specimen
- Whole blood
- Method
- Light microscopy
- Measures
- Presence / threshold
This tells your lab technician whether neutrophils, the white blood cells that engulf and destroy bacteria, show vacuoles (small internal bubbles) when examined under the microscope. Vacuolization signals that neutrophils are under stress, most often from active bacterial infection or sepsis, though toxic exposures and certain bone marrow disorders can produce the same pattern. This isn't a marker you order on its own, it surfaces as a called-out finding on a blood smear when something in your CBC warrants a closer look, and it helps confirm or rule out a significant infectious process.
- Specimen
- Whole blood
- Method
- Light microscopy
- Measures
- Presence / threshold
Variant lymphocytes (also called reactive or atypical lymphocytes) are lymphocytes that have changed shape and activity in response to a viral fight, most often Epstein-Barr virus (mono) but also CMV, hepatitis, or other infections. This percentage flags an active or recent viral immune response and helps explain fatigue, sore throat, swollen glands, or prolonged low energy that a standard white cell count leaves unexplained. A rise here alongside symptoms typically prompts follow-up testing for mono or other viral causes rather than assuming the fatigue is lifestyle-driven.
- Specimen
- Whole blood
- Method
- Automated cell count
- Measures
- Number fraction (%)
Liver Health
Amylase is an enzyme the pancreas and salivary glands secrete to break dietary starch into sugars. Elevated levels point to acute pancreatitis or salivary gland inflammation, and it's the marker doctors reach for when someone shows up with sudden upper abdominal pain, nausea, or vomiting. Low or normal results help rule the pancreas out when you're chasing down the cause of persistent digestive discomfort.
- Specimen
- Serum or plasma
- Measures
- Enzyme activity
GGT is an enzyme concentrated in liver cells and bile duct linings, and it leaks into blood when liver cells are stressed or bile flow is obstructed. It's the most sensitive marker for alcohol-related liver stress and for checking whether an alkaline phosphatase elevation is coming from the liver or from bone. Rising GGT also shows up alongside fatigue, right-upper-abdominal discomfort, or unexplained changes in other liver enzymes, and it's a useful baseline for tracking how alcohol intake, medications, or fatty liver risk are affecting liver health over time.
- Specimen
- Serum or plasma
- Measures
- Enzyme activity
Lipase is the enzyme your pancreas releases into the gut to break down dietary fat, and normally only trace amounts leak into blood. A sharp rise signals pancreatic cells are injured or inflamed, making this the go-to marker for investigating sudden severe abdominal pain radiating to the back, especially with nausea or vomiting. It's more specific to the pancreas than amylase, so it's the better single test when acute pancreatitis is on the table, whether from gallstones, alcohol, certain medications, or high triglycerides.
- Specimen
- Serum or plasma
- Measures
- Enzyme activity
Cancer Screening
PSA is a protein made by prostate cells, and this test measures its total concentration in blood without separating the free and bound fractions. Levels rise with prostate enlargement, inflammation (prostatitis), and prostate cancer, which is why it's the standard tool for prostate cancer screening in men over 50 (or earlier with family history) and for tracking known prostate conditions over time. Rising trends matter as much as single values, so testing PSA on a routine schedule lets you catch upward movement early rather than reacting to a single high number.
- Specimen
- Serum or plasma
- Measures
- Mass concentration
Energy & Metabolism
Albumin is the protein your liver churns out in the largest quantity, and it does double duty: it holds water inside your blood vessels (so fluid doesn't leak into tissue) and ferries hormones, fatty acids, and medications through your bloodstream. Low albumin points to liver disease, kidney protein loss, chronic inflammation, or poor nutrition, and often shows up alongside swelling, fatigue, or unexplained weight loss. Because it reflects both liver production and overall protein status, it's a useful baseline check and a quick way to see whether inflammation or malnutrition is quietly dragging your protein reserves down.
- Specimen
- Serum or plasma
- Measures
- Mass concentration
The albumin/globulin ratio compares your two main blood protein groups: albumin, made by the liver to hold fluid in vessels and carry hormones and nutrients, and globulins, produced largely by the immune system to fight infection and transport other molecules. A low ratio points to liver disease, kidney protein loss, chronic inflammation, or an overactive immune system driving up globulins, while a high ratio suggests low globulin production or an immune system that is underactive. Pair it with total protein, albumin, and liver enzymes to sort out whether fatigue, swelling, or unexplained weight change traces back to your liver, kidneys, or immune activity.
- Specimen
- Serum or plasma
- Measures
- Ratio
- Specimen
- Serum or plasma
- Measures
- Enzyme activity
ALT is an enzyme that lives mostly inside liver cells, where it helps metabolize amino acids. When liver cells get inflamed or damaged, from alcohol, fatty liver, viral hepatitis, or certain medications and supplements, they leak ALT into the bloodstream, making it the most specific marker of liver cell injury on a standard panel. It's worth tracking as a baseline if you drink regularly, use supplements or medications processed by the liver, or carry extra weight, and worth investigating if you have unexplained fatigue, abdominal discomfort, or nausea, since ALT often rises well before symptoms do.
- Specimen
- Serum or plasma
- Measures
- Enzyme activity
AST is an enzyme that lives inside liver cells (and muscle and heart cells too), and it spills into your blood when those cells get damaged. High AST flags liver strain from alcohol, fatty liver, medications, or infection, though muscle damage from intense training can also push it up, which is why it's usually read alongside ALT to pinpoint the source. It's worth tracking as a baseline for liver health, before starting a new supplement or medication, or when investigating fatigue, abdominal discomfort, or unexplained changes in appetite.
- Specimen
- Serum or plasma
- Measures
- Enzyme activity
Calcium does far more than build bone: nerves fire, muscles contract, blood clots, and hormones release only when calcium levels stay in a tight range. This test measures total calcium in serum, which parathyroid hormone and vitamin D regulate together with your bones acting as the reserve tank. High calcium points to overactive parathyroid glands, excess vitamin D, or certain cancers, while low calcium suggests parathyroid or kidney dysfunction, vitamin D deficiency, or poor absorption, and either extreme can drive fatigue, muscle cramps, tingling, brain fog, or irregular heartbeat worth investigating.
- Specimen
- Serum or plasma
- Measures
- Mass concentration
Total CO2 measures the bicarbonate-based buffer your blood uses to keep pH stable, reflecting how your lungs and kidneys balance acid and base. Low levels point toward metabolic acidosis (from kidney disease, uncontrolled diabetes, or chronic diarrhea) while high levels suggest metabolic alkalosis or a compensated respiratory condition, both worth clarifying if you're dealing with unexplained fatigue, rapid breathing, or confusion. It's part of the standard electrolyte panel, so most people track it as a baseline metabolic marker alongside sodium, potassium, and chloride rather than ordering it alone.
- Specimen
- Serum or plasma
- Measures
- Substance concentration
Chloride is the main negative ion in your blood, working alongside sodium and bicarbonate to hold fluid balance, blood volume, and acid-base status steady. Low levels track with vomiting, dehydration, or metabolic alkalosis, while high levels point toward dehydration or metabolic acidosis, often from kidney or GI losses. Ordered as part of a basic metabolic panel, it mainly serves as a baseline check and a way to make sense of symptoms like dizziness, muscle cramps, or persistent fatigue tied to fluid or electrolyte shifts.
- Specimen
- Serum or plasma
- Measures
- Substance concentration
Creatinine is a waste product released as your muscles break down creatine for energy, and your kidneys filter it out of the blood at a steady rate. When creatinine rises, it usually means the kidneys are filtering less efficiently, making it the core marker for kidney function and the basis for calculating eGFR. Test it as a baseline for kidney health, to monitor the impact of blood pressure, diabetes, high-protein diets, or supplements like creatine, or to investigate unexplained fatigue, swelling, or changes in urination.
- Specimen
- Serum or plasma
- Measures
- Mass concentration
Globulin is calculated by subtracting albumin from total protein, capturing the group of proteins your liver and immune system produce, including antibodies that fight infection and carrier proteins that transport hormones and nutrients. High globulin points to chronic inflammation, infection, or an overactive immune system producing excess antibodies, sometimes seen in autoimmune disease or certain blood cancers, while low globulin suggests impaired liver production or immune suppression. Paired with albumin and total protein, it helps clarify unexplained fatigue, recurrent infections, or abnormal liver panels, and gives proactive testers a baseline read on liver and immune protein production.
- Specimen
- Serum
- Measures
- Mass concentration
Glucose measures the sugar circulating in your blood right now, the fuel your cells burn for energy and the hormone insulin works constantly to keep in range. High readings point toward insulin resistance, prediabetes, or diabetes, while low readings can explain shakiness, lightheadedness, irritability, or brain fog between meals. Pair it with fasting insulin or A1c to see whether your body is managing glucose efficiently or working overtime to do it, and use it to track how diet, training, or sleep changes are actually moving your metabolism.
- Specimen
- Serum or plasma
- Measures
- Mass concentration
HbA1c measures the fraction of hemoglobin that glucose has permanently attached to over the roughly three-month lifespan of a red blood cell, giving you an average blood sugar reading rather than a single-moment snapshot. Elevated levels point to prediabetes or diabetes and reflect cumulative glucose exposure that drives vascular damage, so it's a core piece of cardiovascular and metabolic risk assessment even before symptoms appear. It also pairs well with fasting insulin and glucose to track how diet, training, weight loss, or medication are actually changing your metabolic trajectory over time.
- Specimen
- Whole blood
- Measures
- Mass fraction (%)
Insulin is the hormone your pancreas releases to shuttle glucose into cells, and this test measures it directly, typically fasting, alongside glucose. Elevated fasting insulin often shows up years before glucose rises, since the body compensates for resistant cells by pumping out more insulin, so this catches insulin resistance while standard glucose or A1c still look normal. It pairs well with fasting glucose to calculate HOMA-IR, and it's useful both for a metabolic baseline and for investigating stubborn belly fat, energy crashes after meals, or a family history of type 2 diabetes.
- Specimen
- Serum or plasma
- Measures
- Concentration
Potassium regulates the electrical signaling that fires your heart muscle, contracts your muscles, and controls nerve conduction, with cells and kidneys working together to keep it in a tight range. Levels that drift high or low show up as muscle weakness, cramping, palpitations, or fatigue, and can result from dehydration, kidney function changes, certain blood pressure medications, or heavy sweating from training. It's a core piece of any electrolyte or kidney panel, useful for a baseline check and essential context if you're on diuretics, ACE inhibitors, or pushing hard in endurance training where fluid and mineral losses run high.
- Specimen
- Serum or plasma
- Measures
- Substance concentration
Sodium is the main electrolyte outside your cells and it controls how water distributes across your body, keeping blood volume and blood pressure stable while nerves and muscles fire correctly. Low sodium shows up as fatigue, headache, confusion, nausea, or muscle cramps, and points to excess water retention, heavy sweating, certain medications, or kidney and hormone issues, while high sodium usually signals dehydration. It's a core part of any metabolic panel, useful as a baseline check and essential for investigating unexplained fatigue, dizziness, or muscle cramping, especially in endurance athletes or anyone on diuretics.
- Specimen
- Serum or plasma
- Measures
- Substance concentration
Total bilirubin measures the pigment left over when your body breaks down old red blood cells, a job the liver clears by processing it into bile. High levels point to a liver struggling to keep up (hepatitis, fatty liver, bile duct blockage) or red cells breaking down faster than normal, and often show up as yellowing skin or eyes, dark urine, or fatigue. It pairs with ALT, AST, and ALP to pinpoint whether a problem sits in the liver cells, the bile ducts, or upstream in the blood itself, and mildly elevated results with otherwise normal liver panels usually reflect Gilbert's syndrome, a harmless and common genetic quirk.
- Specimen
- Serum or plasma
- Measures
- Mass concentration
Total protein adds up albumin and globulins, the workhorses that hold fluid in your blood vessels, carry hormones and nutrients, and fuel your immune defenses. Low levels point toward liver disease, kidney loss of protein, malnutrition, or poor absorption, while high levels can flag chronic inflammation or dehydration. It's a quick baseline check within a metabolic panel, and if your levels drift off, it usually leads straight to albumin and globulin breakdowns to pinpoint what's driving it.
- Specimen
- Serum or plasma
- Measures
- Mass concentration
Blood urea nitrogen tracks the waste product your liver makes when it breaks down protein, cleared by kidneys that filter it out of circulation. High BUN points to reduced kidney filtration, dehydration, or a high protein intake, while low levels can reflect liver trouble or very low protein diets. Paired with creatinine, it rounds out a kidney function baseline and helps investigate fatigue, swelling, changes in urination, or unexplained shifts tied to diet, hydration, or medication changes.
- Specimen
- Serum or plasma
- Measures
- Mass concentration
Uric acid is the breakdown product of purines from cell turnover and diet, cleared by the kidneys once it's made. High levels mean your body is producing more than it can clear, which crystallizes in joints and causes gout, and independently tracks with hypertension, kidney stones, fatty liver, and metabolic syndrome. Testing it makes sense as a baseline alongside metabolic panels, to investigate joint pain or swelling, or to monitor levels if you're managing diet, alcohol intake, or medications known to raise it.
- Specimen
- Serum or plasma
- Measures
- Mass concentration
Kidney Health
Cystatin C is a protein made by nearly every cell in your body at a steady rate and cleared exclusively by the kidneys, which makes it a cleaner marker of filtration than creatinine, since creatinine shifts with muscle mass, diet, and workouts. Rising cystatin C signals declining kidney filtration before creatinine or symptoms catch up, useful for anyone tracking kidney health alongside blood pressure, diabetes risk, or long-term NSAID or supplement use. It's especially valuable for athletes and heavily muscled people, where creatinine runs high for reasons that have nothing to do with kidney function, and for getting an early, accurate baseline on how well your kidneys are actually clearing waste.
- Specimen
- Serum or plasma
- Measures
- Mass concentration
This estimates how fast your kidneys filter blood, calculated from cystatin C instead of creatinine. Cystatin C isn't affected by muscle mass, so it gives a cleaner read on kidney function in athletes, people who are very muscular or very frail, and anyone whose creatinine-based eGFR looks off relative to how they actually feel. A result below 60 signals reduced filtration worth tracking, while pairing it with creatinine-based eGFR helps confirm whether a low number reflects true kidney decline or just muscle mass throwing off the other formula.
- Specimen
- Serum, plasma, or blood
- Method
- Cystatin C-based
- Measures
- Ratio
Nutrients & Minerals
- Specimen
- Serum or plasma
- Measures
- Mass concentration
Ferritin stores iron inside cells and reveals how much iron your body has banked for making red blood cells, energy, and thyroid hormone. Low ferritin is usually the earliest sign of depleting iron reserves, often showing up as fatigue, hair shedding, poor exercise tolerance, or brain fog well before anemia appears on a standard blood count. High ferritin can reflect iron overload, but it also rises with inflammation, heavy alcohol use, or liver stress, so it doubles as a useful baseline for athletes tracking recovery and a first clue when something else is inflaming the system.
- Specimen
- Serum or plasma
- Measures
- Mass concentration
Folate fuels the one-carbon reactions that build DNA and recycle homocysteine, work that shows up fastest in cells that divide quickly, like red blood cells. Low folate produces the same picture as B12 deficiency: fatigue, weakness, poor concentration, irritability, and large, immature red blood cells (macrocytic anemia), so the two are usually tested together to sort out which one is driving symptoms. It's also relevant during preconception and pregnancy planning, since adequate folate is what prevents neural tube defects, and worth checking if you drink heavily, follow a restrictive diet, or take medications that interfere with folate metabolism.
- Specimen
- Serum or plasma
- Measures
- Mass concentration
Serum iron measures the iron circulating in your blood right now, on its way to the bone marrow to build hemoglobin. It swings with recent diet, time of day, and inflammation, so it works best alongside ferritin, TIBC, and transferrin saturation rather than alone. Low levels help investigate fatigue, weakness, pale skin, and poor exercise tolerance, while high levels can flag hemochromatosis or excess supplementation worth catching before it strains the liver and heart.
- Specimen
- Serum or plasma
- Measures
- Mass concentration
Iron saturation, also called transferrin saturation, calculates the percentage of transferrin (the protein that carries iron through your blood) that's actually loaded with iron. Low saturation points to iron deficiency, useful for investigating fatigue, hair loss, poor exercise tolerance, or restless legs, especially alongside ferritin and total iron. High saturation is the key early flag for hemochromatosis, a condition where the body absorbs too much iron and stores excess in the liver, heart, and joints.
- Specimen
- Serum or plasma
- Measures
- Mass fraction (%)
This measures magnesium stored inside red blood cells, a better gauge of your body's true magnesium reserves than a standard serum test, since blood magnesium stays normal until stores run quite low. Magnesium powers hundreds of enzyme reactions: it relaxes muscle fibers, calms nerve signaling, supports insulin sensitivity, and helps generate cellular energy in the mitochondria. Low RBC magnesium shows up as muscle cramps, twitches, poor sleep, headaches, anxiety, or heart palpitations, and it's worth checking if you train hard, drink alcohol regularly, or take medications that deplete magnesium.
- Specimen
- Red blood cells
- Measures
- Mass concentration
TIBC measures how much iron your blood could carry if every binding site on transferrin were filled, reflecting how hungry your body is for iron. TIBC rises when iron stores run low, since the liver produces more transferrin to hunt down whatever iron is available, and it falls with inflammation, liver disease, or iron overload. Paired with iron and ferritin, it helps distinguish true iron deficiency (high TIBC, low iron) from the low iron levels that chronic inflammation causes, useful for investigating fatigue, hair loss, poor exercise tolerance, or restless legs.
- Specimen
- Serum or plasma
- Measures
- Mass concentration
B12 lets your cells build DNA and lets nerves maintain the myelin sheath that insulates them, so levels here reveal whether your body has what it needs to make red blood cells and keep nerve signals firing cleanly. Low B12 shows up as fatigue, poor concentration, numbness or tingling, weakness, and reduced exercise tolerance, and it's common in vegetarians, vegans, people on metformin or acid-reducing medications, and those with absorption issues like low stomach acid or gut disease. Testing it establishes a baseline if you're plant-based or on these medications, and clarifies whether B12 deficiency, not just poor sleep or overtraining, is behind the fog and fatigue.
- Specimen
- Serum or plasma
- Measures
- Mass concentration
Inflammation & Immunity
ESR measures how fast red blood cells settle to the bottom of a test tube over an hour. Inflammation raises fibrinogen and other proteins that make red cells clump and fall faster, so a high ESR is a blunt but useful signal that something is driving inflammation somewhere in the body. It's most useful for investigating unexplained joint pain, persistent fatigue, fevers, or suspected autoimmune and inflammatory conditions, and for tracking whether a known inflammatory flare is improving or worsening over time.
- Specimen
- Whole blood
- Method
- Westergren (ESR)
- Measures
- Sedimentation rate
Homocysteine is an amino acid byproduct of protein metabolism, and B vitamins (B12, B6, folate) clear it from the blood before it builds up. When those vitamins run low, homocysteine rises, which is why it's a useful cross-check on B12 and folate status, especially in vegetarians, vegans, or anyone on metformin or acid-reducing medication. Elevated levels are also an independent marker of cardiovascular and cognitive risk, so it's worth tracking as a baseline alongside ApoB and Lp(a), or investigating if you're dealing with fatigue, brain fog, or numbness and tingling.
- Specimen
- Serum or plasma
- Measures
- Substance concentration
High-sensitivity CRP measures low-grade inflammation circulating in your blood, well below the threshold standard CRP tests are built to detect. The liver releases CRP in response to arterial inflammation, and elevated levels predict cardiovascular risk independent of cholesterol, making this a key add-on to ApoB or Lp(a) for anyone building a real risk picture or tracking whether diet and training changes are actually lowering inflammation. It also helps explain persistent fatigue, joint aches, or unresolved symptoms when something inflammatory is suspected but not yet identified.
- Specimen
- Serum or plasma
- Method
- High sensitivity
- Measures
- Mass concentration
Heavy Metals
This test measures arsenic circulating in whole blood, reflecting recent exposure from contaminated water, seafood, rice, or certain occupational settings. Elevated levels can drive fatigue, nausea, abdominal pain, tingling in the hands and feet, skin changes, and in chronic cases have been linked to cardiovascular and cognitive effects. It's worth checking if you eat a lot of rice or shellfish, drink well water, work around pesticides or metal processing, or have unexplained GI and neurological symptoms you want to rule causes in or out for.
- Specimen
- Whole blood
- Measures
- Mass concentration
- Specimen
- Venous blood
- Measures
- Mass concentration
Blood mercury measures total mercury exposure, mostly from methylmercury in seafood, which accumulates in blood, kidney, and brain tissue rather than being cleared quickly. High levels track with frequent consumption of tuna, swordfish, or other large predatory fish, and can contribute to fatigue, brain fog, tingling, headaches, or memory complaints. It's a useful check if you eat a lot of fish, take fish oil or supplements of unclear purity, or want a baseline before increasing seafood intake for its cardiovascular and cognitive benefits.
- Specimen
- Whole blood
- Measures
- Mass concentration
Other
Helps differentiate between types of kidney dysfunction.
Adjusted calcium level, considering albumin levels, crucial for accurate assessment.
Ratio of cortisol to DHEA-Sulfate, assessing stress levels and adrenal health.
Average blood glucose level over the past few months; relates to HbA1c.
Estimates kidney filtration rate using both creatinine and cystatin C levels.
Estimates liver fibrosis based on age, AST, ALT, and platelet count.
Assesses balance between anabolic and catabolic hormones, indicating recovery and stress levels.
Higher ratio indicates higher risk of heart disease.
Urine
- Specimen
- Urine
- Measures
- Ratio
- Specimen
- Urine sediment
- Method
- Light microscopy
- Measures
- Presence / threshold
This test counts bacteria per high power field in urine sediment examined under a microscope, a direct look for organisms that shouldn't be living in your urinary tract. Elevated counts point to a urinary tract infection, especially alongside white blood cells, and often explain burning with urination, urgency, frequency, pelvic pain, or cloudy, foul-smelling urine. It's a quick way to confirm or rule out infection when symptoms flare, or to check that a prior UTI has actually cleared.
- Specimen
- Urine sediment
- Method
- Light microscopy
- Measures
- Count per area
This dipstick check flags whether bilirubin, a breakdown product of old red blood cells that your liver normally processes into bile, is leaking into your urine. Healthy urine carries none of it, so a positive result points to conjugated bilirubin backing up into the bloodstream, a sign of bile duct obstruction, hepatitis, or other liver dysfunction. It's a useful piece of the puzzle when you're investigating dark urine, yellowing skin or eyes, pale stools, itching, or unexplained fatigue, and it often shows up on the same strip as urobilinogen for a fuller read on liver and bile flow.
- Specimen
- Urine
- Method
- Test strip
- Measures
- Presence / threshold
This marker counts calcium oxalate crystals seen directly under the microscope in a spun sample of your urine, the same crystal type that forms most kidney stones. Finding them is common and often harmless, but frequent or heavy amounts point to concentrated urine, low fluid intake, or a diet high in oxalate (spinach, nuts, chocolate, tea), and correlate with stone risk over time. It's a useful check if you've had a kidney stone before, get recurrent flank pain or blood in your urine, or want to confirm that hydration and dietary changes are actually reducing your crystal load.
- Specimen
- Urine sediment
- Method
- Light microscopy
- Measures
- Count per area
- Specimen
- Urine sediment
- Method
- Light microscopy
- Measures
- Count per area
This test looks under the microscope at urine sediment to count crystals per high power field, the mineral and salt deposits that form when urine holds more of a substance than it can keep dissolved. Certain crystal types point to specific problems: calcium oxalate and uric acid crystals often accompany kidney stone formation, while others can flag dehydration, diet extremes, or liver and metabolic conditions. It's a useful add-on if you've had flank pain, blood in your urine, or a history of kidney stones, and useful for tracking whether hydration or dietary changes are actually reducing stone-forming risk.
- Specimen
- Urine sediment
- Method
- Light microscopy
- Measures
- Count per area
Granular casts are cylindrical clumps of degenerated cellular material that form in the kidney's tubules and wash out into urine, visible under the microscope during a urine sediment exam. A few granular casts can turn up after hard exercise or dehydration, but larger numbers point to tubular cell injury and often show up in acute kidney injury, dehydration, or chronic kidney disease. This test is useful for investigating unexplained changes in urine output, swelling, rising creatinine, or fatigue, and for tracking kidney recovery after an insult like illness, medication exposure, or a low-flow event.
- Specimen
- Urine sediment
- Method
- Light microscopy
- Measures
- Count per area
This dipstick screen detects hemoglobin in urine, the protein that carries oxygen in red blood cells and, when present in urine, signals that blood is leaking somewhere along the kidneys or urinary tract. A positive result points to causes ranging from kidney irritation, UTIs, kidney stones, or strenuous exercise, to more serious conditions like kidney disease that warrant follow-up. It is a simple way to catch silent urinary tract or kidney issues before symptoms like pain, changes in urination, or visible blood appear.
- Specimen
- Urine
- Method
- Test strip
- Measures
- Presence / threshold
Hyaline casts are protein molds that form in the kidney's tubules and wash into urine, and technicians count them under the microscope during a urine sediment exam. A few are normal, especially after exercise, dehydration, or a fever, so an isolated finding usually needs no action. A high number, particularly alongside protein in urine, reduced output, or symptoms like swelling and fatigue, points toward more concentrated urine or early kidney stress worth tracking with follow-up testing.
- Specimen
- Urine sediment
- Method
- Light microscopy
- Measures
- Count per area
This dipstick test detects ketones spilling into urine when the body burns fat for fuel instead of glucose. It's useful for tracking a ketogenic or low-carb diet, confirming your body has shifted into fat-burning mode, or checking on a fasting protocol. Unexplained positive results paired with high blood sugar, excessive thirst, or fatigue warrant prompt follow-up, since that combination can signal diabetic ketoacidosis rather than diet-driven ketosis.
- Specimen
- Urine
- Method
- Test strip
- Measures
- Presence / threshold
Leukocyte esterase is an enzyme released by white blood cells, and this dipstick test detects it in urine as a marker of inflammation in the urinary tract. A positive result signals that neutrophils have shown up to fight something, usually a urinary tract infection, and often shows up alongside symptoms like burning with urination, urgency, frequency, or pelvic discomfort. It pairs with urine nitrites and a urinalysis to confirm infection and decide whether further culture or treatment is needed.
- Specimen
- Urine
- Method
- Test strip
- Measures
- Presence / threshold
Healthy kidneys hold onto albumin, filtering blood while keeping this protein out of urine. This test measures how much albumin leaks through, and even small amounts signal that the kidney's filtering barrier is starting to wear down, often years before creatinine or eGFR shift. It's a key early marker for diabetes and high blood pressure related kidney damage, so it's worth tracking as a baseline if you have either condition, a family history, or want to catch declining kidney function while it's still fully reversible.
- Specimen
- Urine
- Method
- High-sensitivity assay
- Measures
- Mass concentration
This dipstick reading detects nitrite in urine, produced when certain bacteria (E. coli and other common culprits) convert dietary nitrate into nitrite as they multiply. A positive result signals a likely urinary tract infection and pairs with leukocyte esterase to confirm it, useful when you're tracking down burning urination, urgency, frequency, or pelvic discomfort. It's also a quick proactive check if you're prone to recurrent UTIs and want to catch one early, before it climbs to the kidneys.
- Specimen
- Urine
- Method
- Test strip
- Measures
- Presence / threshold
This measures how acidic or alkaline your urine is, a quick readout of how your kidneys manage acid-base balance and a marker that shifts with diet, hydration, and metabolic state. Persistently low (acidic) urine is linked to kidney stone formation, particularly uric acid stones, while high (alkaline) urine points to certain infections or renal tubular issues and can favor calcium phosphate stones. If you've had kidney stones before, get recurring UTIs, or are dialing in a diet (high protein, keto, or heavy produce intake) and want to see how it's shifting your body's chemistry, this is a fast way to check.
- Specimen
- Urine
- Method
- Test strip
- Measures
- Concentration
This test counts red blood cells per high-power field in urine sediment examined directly under the microscope, catching hematuria that dipstick testing can miss or falsely flag. Elevated counts point toward kidney or urinary tract sources of bleeding: infection, kidney stones, inflammation in the filtering units of the kidney, or irritation anywhere along the bladder and urinary tract. It's useful both as a routine check on kidney and urinary health and for investigating visible blood in urine, unexplained flank pain, or burning with urination.
- Specimen
- Urine sediment
- Method
- Light microscopy
- Measures
- Count per area
Renal epithelial cells line the kidney's tubules, and finding them shed into urine sediment means those tubules are shedding their lining faster than normal. A microscopist counts them per high power field, and elevated numbers point to acute tubular injury, infection, or toxin exposure (from medications, contrast dye, or heavy metals) rather than a bladder or urethral source of blood or protein. This test is most useful when you already have signs of kidney irritation, such as unexplained protein or blood in urine, and need to pinpoint whether the tubules themselves are under stress.
- Specimen
- Urine sediment
- Method
- Light microscopy
- Measures
- Count per area
Specific gravity measures how concentrated your urine is, comparing it to the density of pure water, and it reflects how well your kidneys balance water and dissolved solutes. High values point to dehydration or concentrated urine, while very low values suggest overhydration or a kidney's reduced ability to concentrate urine at all. It's a quick check for hydration status when you're tracking fluid intake around training, and a useful clue when investigating dark urine, low urine output, or unexplained thirst and fatigue.
- Specimen
- Urine
- Method
- Test strip
- Measures
- Specific gravity
This counts squamous epithelial cells shed into urine sediment and viewed under the microscope, cells that line the urethra, vagina, and outer skin rather than the kidney or bladder itself. A high count usually signals that the sample picked up cells from external contamination during collection rather than pointing to disease, which matters for interpreting everything else in the urinalysis correctly. Labs use this count to judge whether a sample is clean enough to trust, so a raised result on a symptom workup (burning, urgency, cloudy urine) often just means a repeat, better collected sample is needed before drawing conclusions about infection or kidney issues.
- Specimen
- Urine sediment
- Method
- Light microscopy
- Measures
- Count per area
Transitional cells line the bladder, ureters, and upper urethra, forming a flexible barrier that stretches as your bladder fills and shields deeper tissue from urine's caustic contents. Finding more than a few under the microscope points to irritation from a urinary tract infection, catheter use, or kidney stones, and persistently elevated or atypical counts warrant a closer look at the bladder lining. This one usually comes up when someone is investigating urinary symptoms like burning, urgency, or blood in the urine rather than as a routine baseline check.
- Specimen
- Urine sediment
- Method
- Light microscopy
- Measures
- Count per area
This measures triple phosphate (struvite) crystals seen under the microscope when a urine sample is examined for sediment. These crystals form in alkaline urine and often point to a urease-producing bacterial infection (commonly Proteus), so finding them alongside symptoms like cloudy urine, urinary urgency, flank pain, or recurrent UTIs helps confirm infection and flags a risk factor for struvite kidney stones. For most people this is a follow-up test rather than a routine baseline, ordered when a urinalysis raises questions about infection or stone risk.
- Specimen
- Urine sediment
- Method
- Light microscopy
- Measures
- Count per area
This test looks for urate crystals in urine sediment under the microscope, a marker of how concentrated your urine is and how acidic your pH runs. Crystals show up when urine is too acidic or too concentrated for uric acid to stay dissolved, conditions that also favor kidney stone formation. If you've had a uric acid kidney stone, gout flares, or unexplained flank pain, this finding connects the dots and often prompts a look at hydration, diet, and urine pH management.
- Specimen
- Urine sediment
- Method
- Light microscopy
- Measures
- Count per area
This records whether urine looks clear, cloudy, or turbid, one of the basic visual checks in a urinalysis. Cloudy urine points to crystals, mucus, white blood cells, bacteria, or excess protein, and often accompanies urinary tract infections, kidney stones, or dehydration. Pairing it with urine color, specific gravity, and microscopy turns a simple visual cue into a fast first read on hydration and urinary tract health.
- Specimen
- Urine
- Measures
- Appearance
Urine color is a simple visual observation, part of a standard urinalysis, that reflects hydration, diet, medications, and sometimes blood or bile in the urine. Pale yellow signals good hydration, while dark amber urine points to concentrated urine and dehydration, and red, brown, or tea colored urine can flag blood, muscle breakdown, or liver issues that warrant a closer look. It's a quick baseline check alongside other urine markers, or a useful clue when investigating unusual fatigue, dark urine, or changes in urination.
- Specimen
- Urine
- Measures
- Color
This dipstick check flags whether protein is spilling into your urine at all, a quick presence or absence read rather than a precise count. Healthy kidneys keep protein locked in the blood, so a positive result signals that the filtering units are leaking and deserves a closer look with a quantitative test like urine albumin to creatinine ratio. It's a useful baseline for anyone tracking kidney health alongside blood pressure or blood sugar, and a natural next step if you've noticed foamy urine, swelling in the legs or eyes, or unexplained fatigue.
- Specimen
- Urine
- Method
- Test strip
- Measures
- Presence / threshold
This test counts white blood cells sitting in your urine sediment under the microscope, cell by cell, per high power field. Neutrophils flood into urine when they're fighting a bladder or kidney infection, so elevated counts point to a urinary tract infection, and can also flag inflammation from kidney stones, an enlarged prostate, or, less commonly, interstitial cystitis. It's the natural next step if you're dealing with burning, urgency, cloudy urine, pelvic or flank pain, or a positive leukocyte esterase on a dipstick, and it's how you confirm an infection is actually clearing after treatment.
- Specimen
- Urine sediment
- Method
- Light microscopy
- Measures
- Count per area
This test counts yeast cells per high power field in urine sediment examined under the microscope, usually as part of a urinalysis. Yeast in urine most often signals a fungal infection (commonly Candida), and shows up more frequently in people with diabetes, recent antibiotic use, or a weakened immune response. Paired with symptoms like burning with urination, urgency, or vaginal or genital irritation, it helps distinguish a yeast infection from a bacterial UTI so treatment actually matches the cause.
- Specimen
- Urine sediment
- Method
- Light microscopy
- Measures
- Count per area



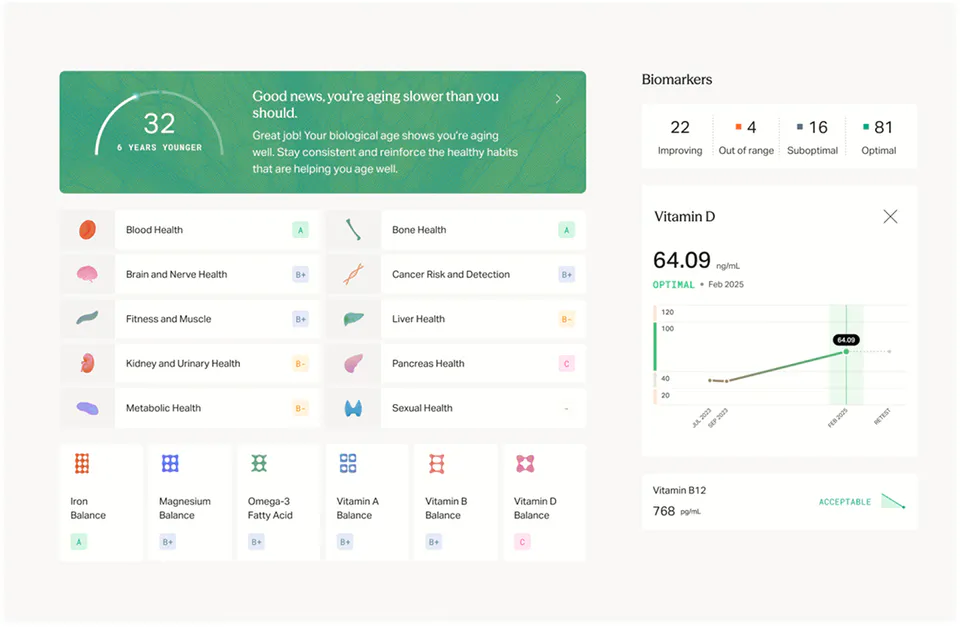
What you'll learn
Insights that connect the dots. A clinician reads your whole picture, not one result in isolation, connecting family history, past results, and lifestyle into clear next steps.
Your personalized action plan. Nutrition, supplements, and training in one clinician-reviewed protocol, updated as your results change.
Track your trends. Upload results from any lab and see each biomarker trend over time, so you know what is working.
Never miss a recheck. Mito tells you what is worth retesting and when, then reminds you so nothing slips.
Compare Mito panels
Choose the level of coverage that fits your goals. Biomarker counts are for the full panel. The sex-specific version you select at checkout can differ by a marker or two.


Want the widest read?
Everything in Pro, plus Galleri multi-cancer early detection and an at-home gut microbiome test.
All three: one blood draw plus a urine sample, at a Quest location near you or with an at-home draw where available. Fast 9 to 12 hours; water is fine. Most results within 3 days. Every result is reviewed by a clinician.
All three: one blood draw plus a urine sample, at a partner lab near you or with an at-home draw where available. Fast 9 to 12 hours; water is fine. Most results within 3 days. Every result is reviewed by a clinician.
Member prices with the $9/month membership, plus a one-time lab draw fee passed through at cost. Typical prices elsewhere are for the same tests bought individually from direct-to-consumer lab retailers, captured August 2026 and rounded.
Member prices with the $9/month membership, plus a one-time lab draw fee passed through at cost.
What to expect
- 1 Book instantly
Click, book, done. Choose a convenient lab location near you. Transparent, up-front pricing.
- 2 Quick lab visit
Testing to fit your busy schedule, usually 15 minutes or less. Walk-in and appointments available.
- 3 Fast, dashboard-delivered results
Your results post straight to your dashboard as soon as the lab completes them.
- 4 Expert guidance
Included with Mito membership. A clinician reviews your results and your personalized action plan follows, with clear next steps.
Check your key markers from home.
The At-Home Longevity Kit tracks the longevity markers that matter most with a near-painless at-home collection. No needle, no clinic, results in days. A simple way to stay on top of your numbers between full panels.
What members are saying
-
@nasdaily
-
15/10 experience - I felt actually taken care of
Super impressed with my Mito experience - the thoroughness of the intake, the data tracking and the doctor's visit.
RS Reena Sudan -
@ellarosemcfadin
-
Helped show an overall picture
I would highly recommend this service to anyone that wants a more in-depth picture of their health and labs. The platform is super user friendly.
BS Bo Sal -
@katelyn_kim
-
Specific and actionable advice
It felt like, for the first time, I had real data guiding me to make meaningful changes and I've definitely noticed the difference.
MH Maya Hickey -
@bryce_witmer
-
Tired of arguing with my PCP
After extensive research, I decided Mito was the best option. The insights were clear and make sense. Mito gave me peace of mind and a path to follow.
JO Josh -
@alexandradawson
-
3x the tests for less money
A great alternative to the basic blood work at your local clinic. Love the report card format. Much better value.
P Page -
@daniklass
-
Best $9 a month I spend
The action plan changes every time new results come in. I've actually never had a health company recommend doing less. Refreshing.
DP Devi Patel -
@natalieefer
-
Finally, prices that make sense
Every test is published. I can see what it costs and what I save as a member. No surprises.
KT Kenji Tanaka -
@tyler_sarkisian
Everything your health needs,
in one membership
-

Every test at our cost
Members pay our cost on every test, with lab fees passed straight through. The full receipt is itemized, never padded.
-

Continuous tracking, all in one place
Upload past labs and watch your trends over time. Every marker and visit lives in one longitudinal record, so all your care stays together.
-

Year-round clinician support
Text anytime and get clinician-reviewed answers. When you want to go deeper, 1:1 consultations are available at affordable rates.
All for $9/month
Order any test or consult without joining. For $9/month, members unlock member prices, trend tracking, and year-round clinician guidance.
Mito Membership
$9 /mo
cancel anytime
Without membership
$0
pay as you go
At-cost pricing on labs, scans, and more
Supplements at member rates NEW
On-demand clinician consults when you need guidance
Personalized action plans across supplements, exercise, nutrition, and sleep
AI health coaching to help you act on your results
Year-round medical support, with in-chat clinician escalation
All your health records in one personal vault, with trends and biological age tracking
Early access to new diagnostics and product releases
More tests to consider
Loading essentials…
Frequently asked questions
View all FAQsHow does pricing work?
Every test shows the member price next to the standard non-member price, so you can see what membership saves you. The member price is our cost, covering the lab and what it takes to run the service. It is never a profit on the test itself. Mito makes its money on the membership, not on marking up your tests. Membership is $9 per month or $99 per year, and any applicable lab order or draw fee is itemized before you pay.
Where do I get tested?
Choose an available partner lab at checkout. If your cart contains multiple blood tests, Mito helps consolidate the eligible tests at one lab when possible. At-home kits and scans follow the collection or appointment process shown on their product page.
Is this eligible for HSA/FSA?
Yes. Mito's lab tests are HSA/FSA eligible, so you can pay with pre-tax dollars.
Add the test to your cart and select "Pay with HSA/FSA" at checkout. You'll finish on the secure checkout page of Flex, our HSA/FSA payments partner, and Flex emails you an itemized receipt from notifications@withflex.com for your records.
Most Mito tests are auto-substantiated, so you usually won't need a Letter of Medical Necessity. If your HSA/FSA administrator asks for more, contact us and we'll help.
When will I get my results?
Your results appear in your Mito dashboard after the laboratory completes processing. A clinician then reviews them before your analysis and personalized action plan are finalized. Timing varies by test, and specialty assays and at-home kits may take longer.
Do I need a physician's order?
No. Mito provides the laboratory order when one is required, so you do not need to arrange a separate physician visit before purchasing.
How do availability and prices vary by state?
Available in 48 states and Washington, DC.
| States | Provider | Availability | Starting member price | Starting non-member price |
|---|---|---|---|---|
| All states and DC except HI, NJ, NY, and RI | Labcorp | Available | $586.54 | $821.32 |
| All states and DC except HI, NJ, NY, and RI | Quest Diagnostics | Available | $323.88 | $453.57 |
| NJ and NY | BioReference | Available | $714.19 | $1000.02 |
| HI and RI | Not currently available |
Recently viewed
Loading essentials…