Insulin Resistance: Early Signs, Best Tests, and How to Reverse It
Insulin resistance often develops silently before diabetes. Learn early warning signs, the most useful biomarkers, and lifestyle strategies that improve insulin sensitivity.

Insulin resistance is not a disease that appears overnight. It is a slow, progressive metabolic deterioration that can simmer for a decade before it shows up on a standard lab report as prediabetes or type 2 diabetes. By that point, significant metabolic damage has already occurred, to your blood vessels, your liver, your hormones, and your cellular energy systems. The tragedy of insulin resistance is not that it is hard to fix. It is that it is hard to catch early, because the conventional diagnostic approach waits until the problem is advanced before it sounds the alarm.
Here is what most people do not know: you can have perfectly normal fasting glucose, the number your annual physical checks, and still have significant insulin resistance. Your pancreas is simply producing more and more insulin to compensate. The glucose stays controlled, the care team lead says everything looks fine, and the metabolic dysfunction deepens silently. The key is measuring insulin itself, not just the glucose it is desperately trying to control.
What Is Insulin Resistance, Exactly?

Insulin is a hormone produced by the beta cells of the pancreas. Its primary role is to shuttle glucose from the bloodstream into cells, particularly muscle, liver, and fat cells, where it can be used for energy or stored for later. In a metabolically healthy person, a small amount of insulin efficiently clears glucose after a meal, and levels return to baseline quickly [1].
Insulin resistance occurs when cells become less responsive to insulin’s signal. The lock-and-key mechanism between insulin and its receptor still works, but the downstream signaling is blunted. The pancreas compensates by producing more insulin, a state called hyperinsulinemia, to force the same glucose-clearing effect. This works for a while. Blood sugar stays normal. But the elevated insulin is doing damage that glucose measurements alone cannot reveal.
The progression looks like this:
Stage | Fasting Glucose | Fasting Insulin | What Is Happening |
|---|---|---|---|
Metabolically healthy | 70, 85 mg/dL | 2, 6 µIU/mL | Cells respond normally. Low insulin clears glucose efficiently. |
Early insulin resistance | 85, 95 mg/dL | 8, 15 µIU/mL | Cells are resistant. Pancreas compensates with more insulin. Glucose looks fine. |
Advanced insulin resistance | 95, 110 mg/dL | 15, 25+ µIU/mL | Pancreas is straining. Glucose starts to creep up. Metabolic damage accelerating. |
Prediabetes / Type 2 diabetes | Above 100, 126 mg/dL | Variable (may decline) | Pancreas begins to fail. Glucose rises overtly. Beta cell burnout begins. |
The critical insight: by the time fasting glucose is elevated, you may have been insulin resistant for 5 to 15 years. This is why fasting insulin is the early warning marker, and why it should be part of every metabolic assessment, not just glucose and HbA1c.
What Are the Signs of Insulin Resistance?
Insulin resistance does not present with a single dramatic symptom. Instead, it produces a constellation of subtle changes that most people normalize or attribute to aging:
-
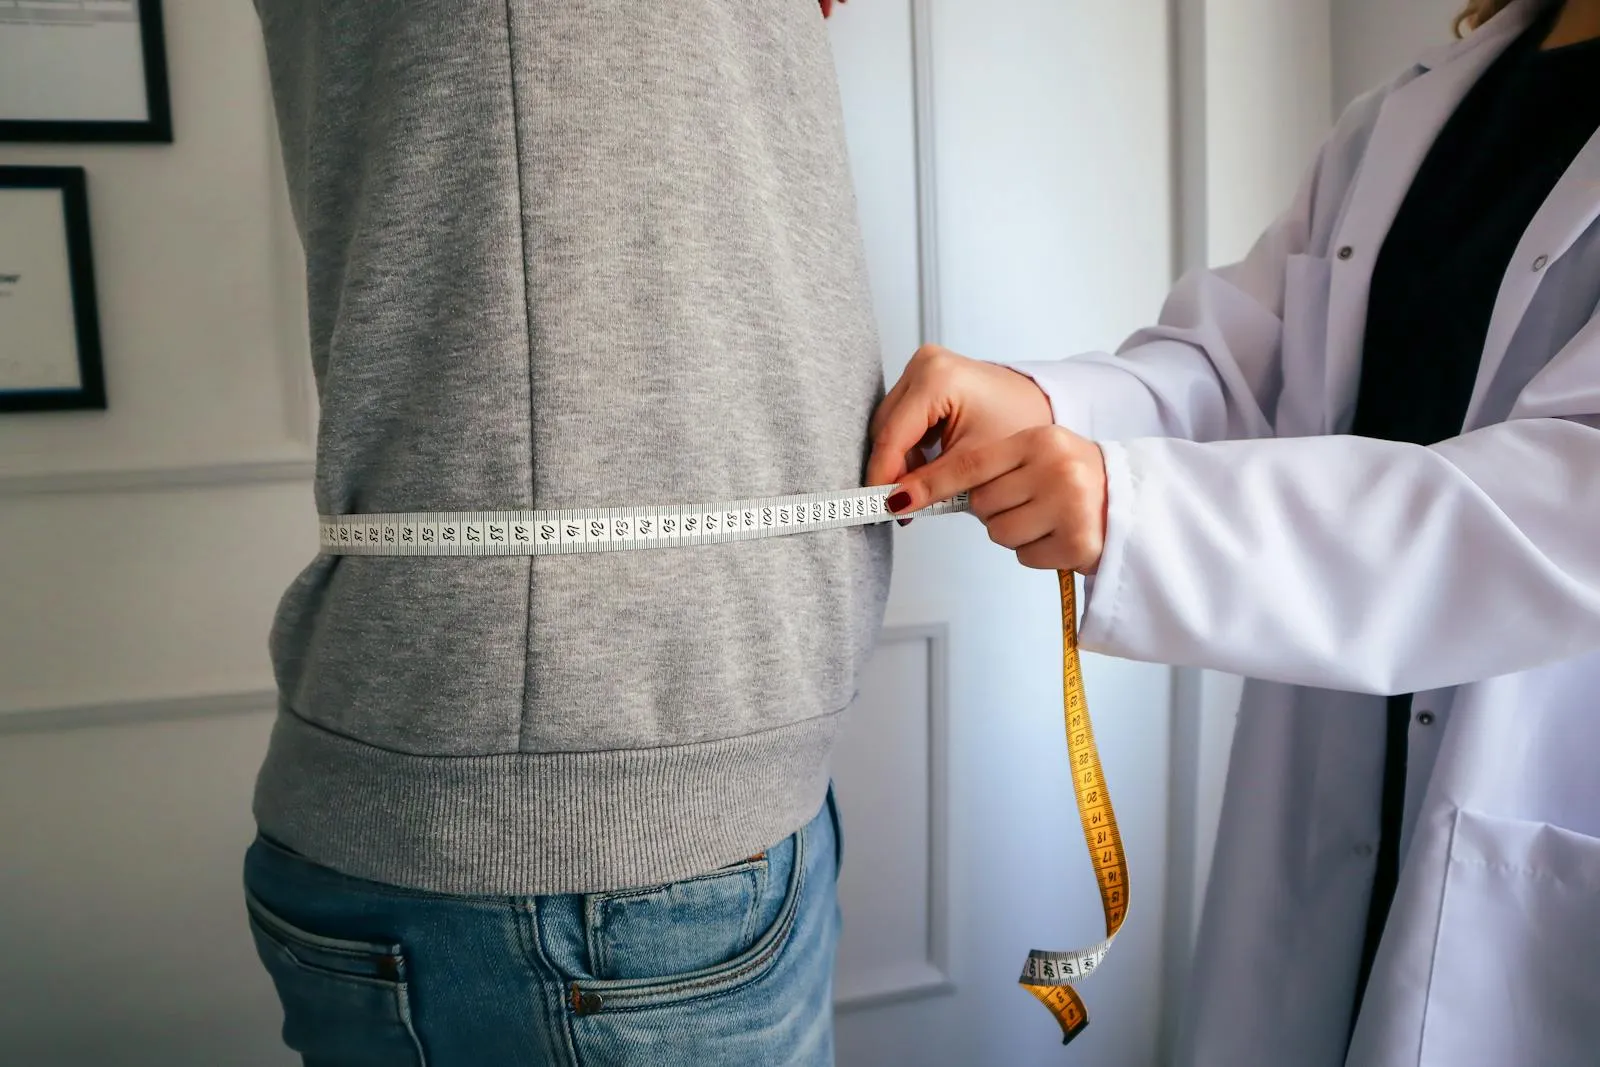
Central weight gain: Fat accumulation around the midsection (visceral adiposity) is the most visible sign. Insulin drives fat storage, and resistant tissues preferentially direct excess energy to visceral fat depots.
-
Energy crashes after meals: Post-meal drowsiness, brain fog, or irritability, especially after carbohydrate-heavy meals, reflects exaggerated insulin spikes followed by reactive hypoglycemia.
-
Persistent sugar and carbohydrate cravings: When cells are not receiving glucose efficiently, your brain perceives an energy deficit and drives cravings for quick-energy foods, creating a vicious cycle.
-
Difficulty losing weight despite caloric restriction: Elevated insulin is a potent fat-storage signal. It actively blocks lipolysis (fat breakdown), making weight loss disproportionately difficult.
-
Acanthosis nigricans: Dark, velvety patches of skin in the neck folds, armpits, or groin. This is a dermatological marker of hyperinsulinemia and is sometimes the first clinical clue.
-
Skin tags: Multiple skin tags, particularly around the neck and axillae, are associated with insulin resistance and metabolic syndrome.
-
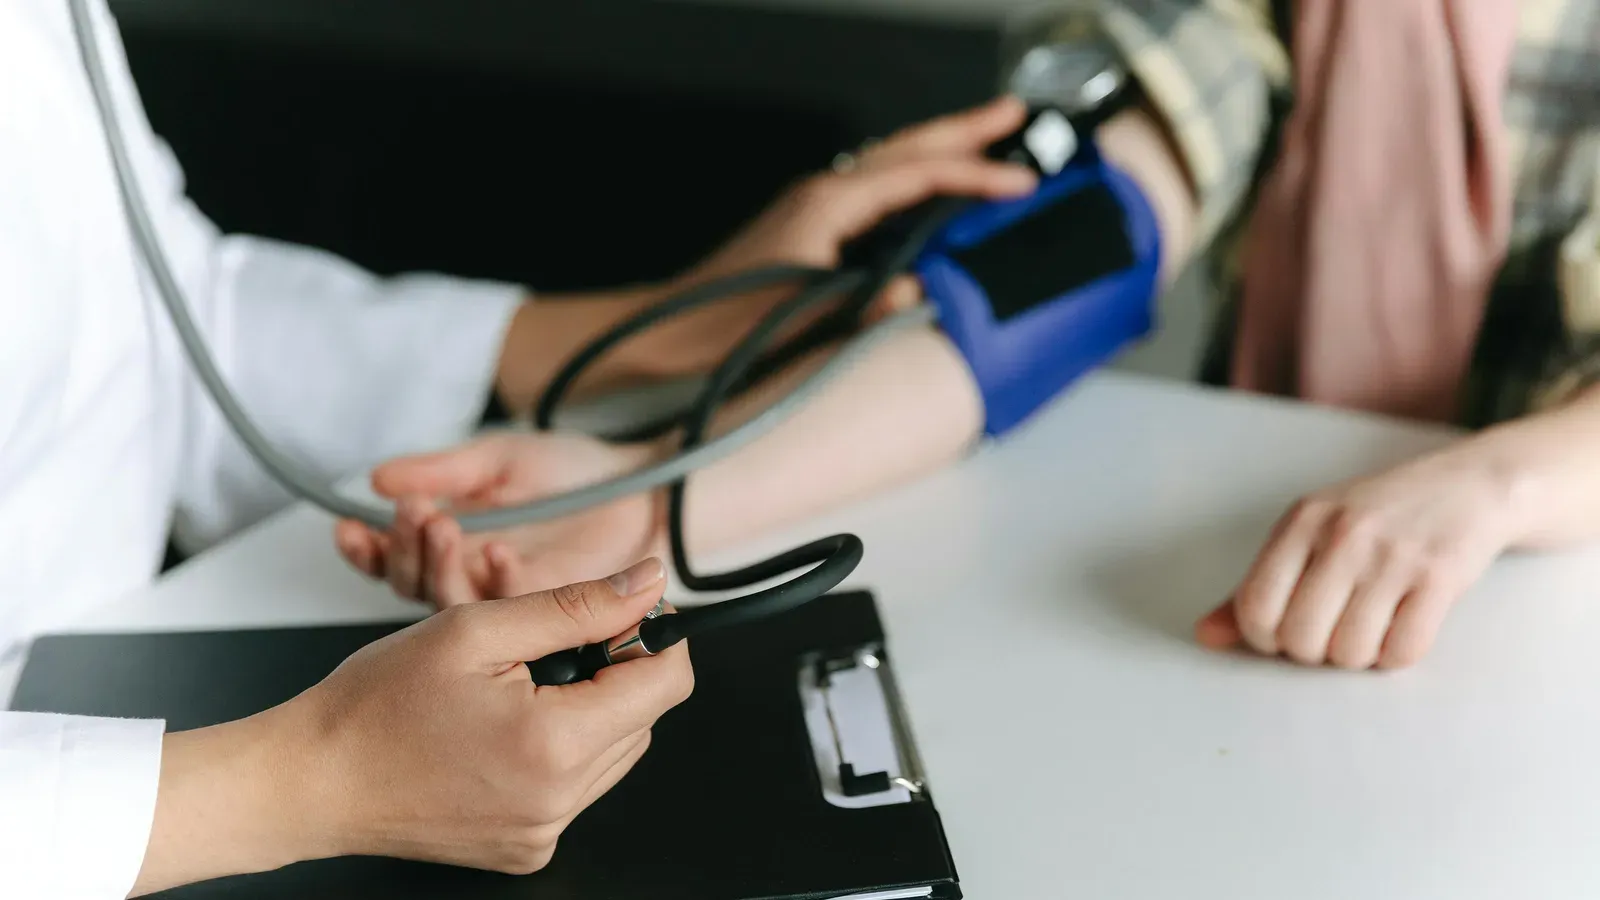
Elevated blood pressure: Insulin promotes sodium retention and sympathetic nervous system activation, both of which raise blood pressure.
-
Abnormal lipid profile: The classic pattern is high triglycerides, low HDL, and elevated small dense LDL particles, driven by insulin-mediated hepatic VLDL overproduction. Your cholesterol-to-HDL ratio may be elevated even if total cholesterol looks acceptable.
If you have three or more of these signs, insulin resistance is not speculative, it is probable. But the signs alone are not diagnostic. You need the lab data.
How to Test for Insulin Resistance
The tests that actually catch insulin resistance, not just its late-stage consequence of elevated glucose:
Fasting Insulin
This is the most direct measurement. A fasting insulin above 8 µIU/mL suggests early resistance; above 12 indicates clinically significant resistance. Optimal is between 2 and 6. Most standard panels do not include fasting insulin, you have to request it explicitly [2].
HOMA-IR (Homeostatic Model Assessment of Insulin Resistance)
Calculated as (fasting glucose × fasting insulin) / 405. A HOMA-IR below 1.0 is optimal. Above 1.5 suggests emerging resistance. Above 2.0 is clinically significant. Above 3.0 indicates severe insulin resistance. This is one of the most validated clinical tools for quantifying insulin resistance outside of a research setting.
HbA1c (Glycated Hemoglobin)
Reflects average blood sugar over 2 to 3 months. Optimal is below 5.4 percent. Between 5.7 and 6.4 is prediabetic. Above 6.5 is diabetic. HbA1c is useful but catches the problem later than fasting insulin, it rises after compensation starts to fail.
Triglyceride-to-HDL Ratio
A powerful surrogate marker for insulin resistance that is available on any standard lipid panel. A ratio below 1.5 is optimal. Above 2.0 suggests resistance. Above 3.5 is strongly correlated with significant metabolic dysfunction. This ratio correlates well with HOMA-IR and can be used as a screening tool.
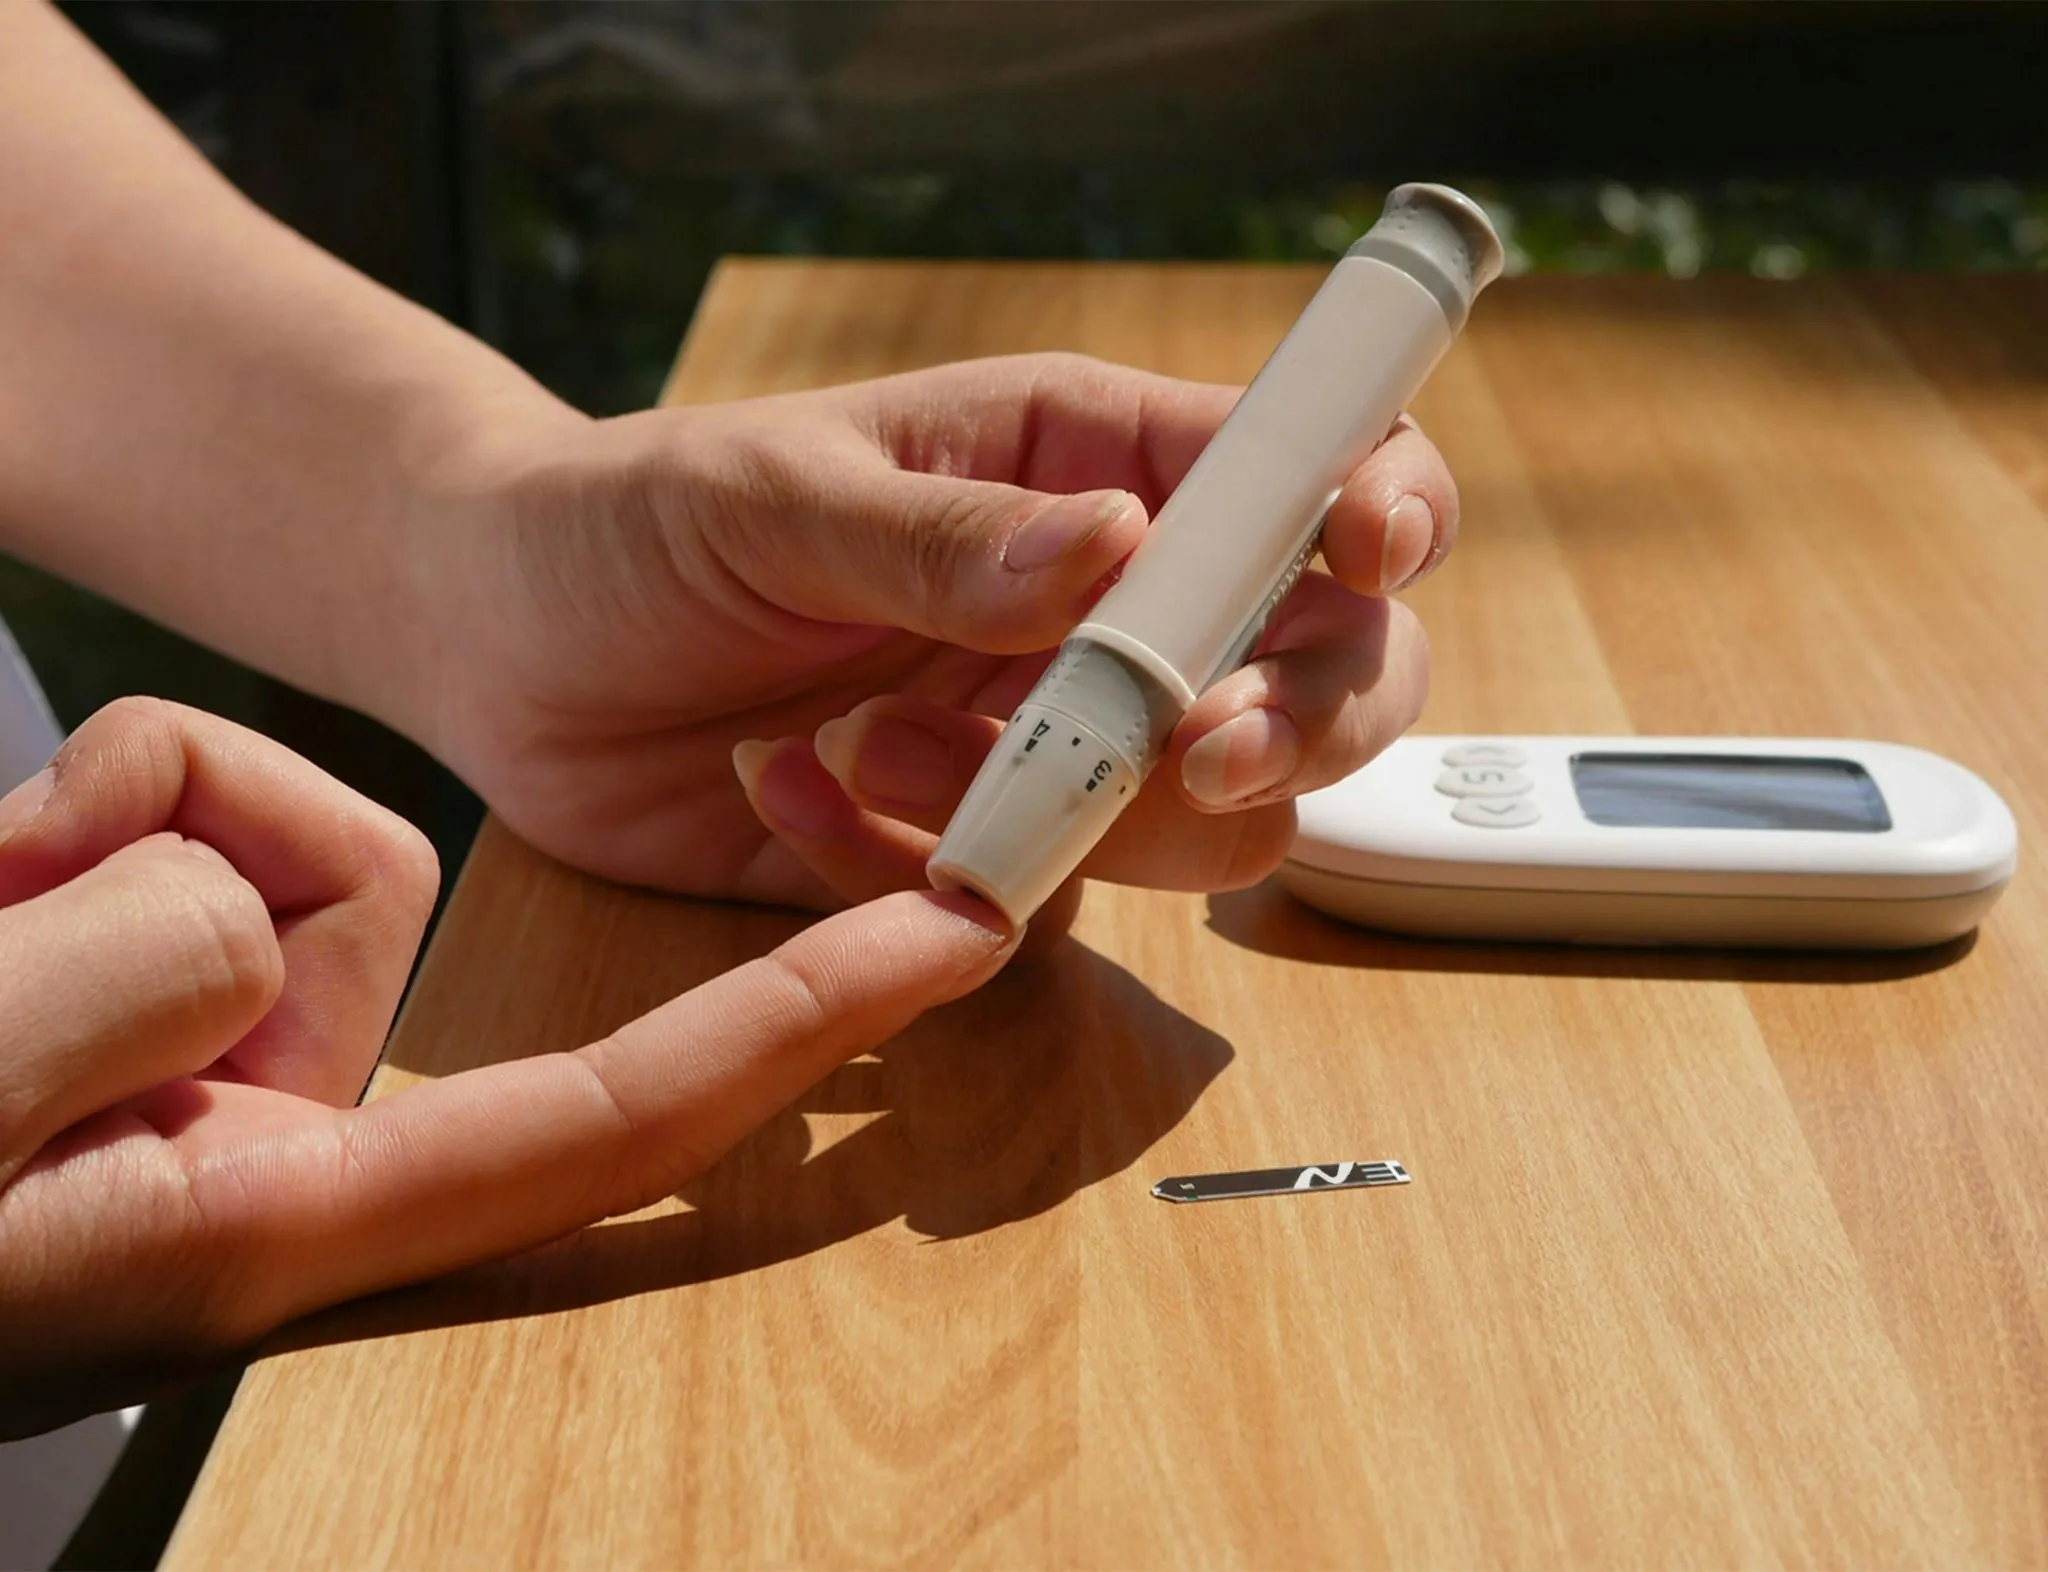
Fasting Glucose
The most commonly tested but least sensitive early marker. By the time fasting glucose is above 100 mg/dL, resistance is well-established. The ideal range for metabolic health is 70 to 85 mg/dL.
hsCRP
Insulin resistance is an inflammatory state. Elevated hsCRP frequently accompanies insulin resistance and reflects the systemic inflammation driving, and caused by, metabolic dysfunction.
Catch insulin resistance before it catches you. Mito Health’s comprehensive panel measures fasting insulin, fasting glucose, HbA1c, full lipid panel (including triglyceride-to-HDL ratio), hsCRP, and over 60 other biomarkers, with care team lead interpretation and a personalized action plan. Plans start at $349 for individuals and $668 for duos. Get your metabolic assessment.
What Causes Insulin Resistance?

Insulin resistance is multifactorial, but the primary drivers are well-established:
-
Excess caloric intake and visceral fat accumulation: Visceral fat is metabolically active tissue that releases inflammatory cytokines (TNF-α, IL-6) and free fatty acids, both of which directly impair insulin signaling in liver and muscle [3].
-
Physical inactivity: Skeletal muscle is the primary site of glucose disposal. Sedentary muscle becomes less insulin-sensitive. Exercise, particularly resistance training, restores insulin signaling through GLUT4 transporter upregulation, independent of weight loss.
-
Chronic high-glycemic diet: Repeated glucose spikes force repeated insulin surges, progressively desensitizing receptors. Refined carbohydrates and added sugars are the primary dietary culprits.
-
Sleep deprivation: Even a single night of poor sleep measurably reduces insulin sensitivity. Chronic sleep restriction (less than 6 hours) increases insulin resistance by 30 to 40 percent [4].
-
Chronic stress and cortisol: Cortisol directly antagonizes insulin action. Chronic stress-driven cortisol elevation promotes both insulin resistance and visceral fat deposition.
-
Genetics: Family history of type 2 diabetes significantly increases susceptibility. Some populations (South Asian, Hispanic, Pacific Islander) have higher genetic predisposition.
How to Reverse Insulin Resistance
The good news, and it is genuinely good news, is that insulin resistance is one of the most reversible metabolic conditions. The same mechanisms that created it can be redirected to resolve it. For a detailed protocol on specific lifestyle interventions, see our comprehensive guide to improving insulin sensitivity.
Here are the foundational strategies:
Resistance Training
This is the single most effective intervention for insulin resistance. Resistance training increases muscle mass (the body’s primary glucose sink), upregulates GLUT4 transporters, and improves insulin sensitivity for 24 to 72 hours after each session [5]. Aim for at least 3 sessions per week targeting all major muscle groups.
Reduce Refined Carbohydrates and Added Sugars
This reduces the glucose load that drives compensatory insulin secretion. Prioritize whole foods, fiber-rich carbohydrates, and adequate protein. You do not need to go zero-carb, reducing the glycemic load of your diet is what matters.
Increase Protein and Fiber Intake
Protein improves satiety and has a minimal insulin-spiking effect compared to carbohydrates. Soluble fiber slows gastric emptying and glucose absorption. Together, they flatten the postprandial glucose curve and reduce compensatory insulin demand.
Prioritize Sleep
Seven to nine hours of quality sleep is non-negotiable for metabolic health. Address sleep apnea if present, it is both a consequence and a driver of insulin resistance.
Manage Body Composition
Even a 5 to 7 percent reduction in body weight produces meaningful improvements in insulin sensitivity. The target is not a number on the scale, it is reducing visceral fat, which can be tracked via waist circumference (goal: below 40 inches for men, 35 for women).
Consider Time-Restricted Eating
Eating within an 8 to 10 hour window and fasting for 14 to 16 hours allows insulin levels to drop to baseline, giving cells a recovery window to restore sensitivity. This is not about caloric restriction, it is about insulin timing.
The Long-Term Consequences of Untreated Insulin Resistance
If left unaddressed, insulin resistance does not stay static. It progresses:
-
Type 2 diabetes: Pancreatic beta cells eventually cannot sustain compensatory output and begin to fail.
-
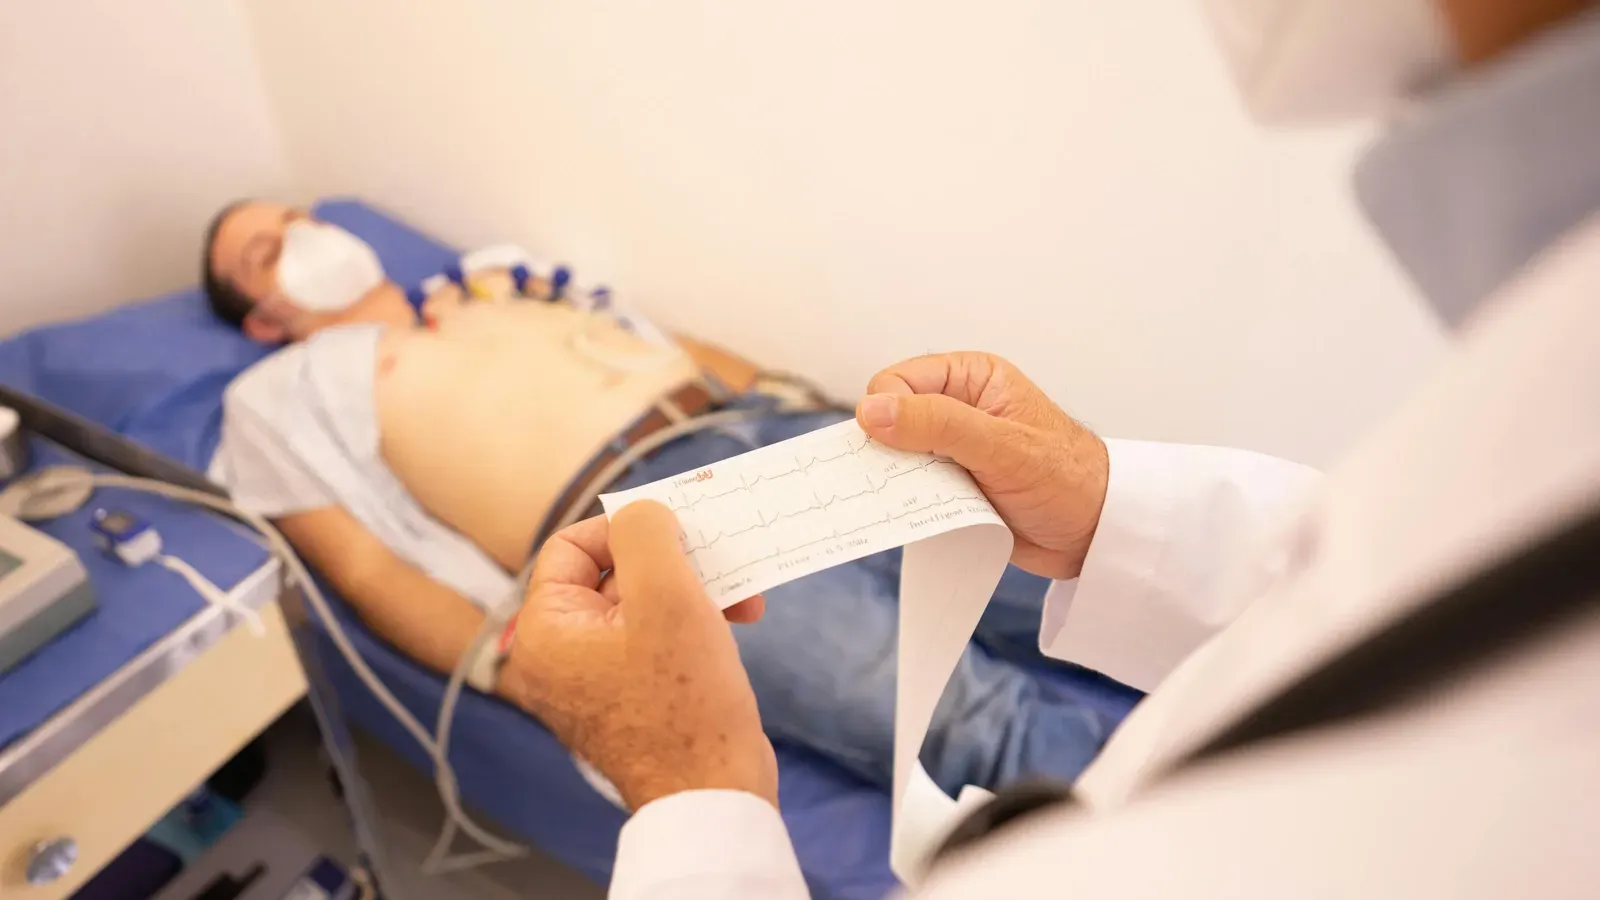
Cardiovascular disease: Hyperinsulinemia independently promotes atherosclerosis, endothelial dysfunction, and thrombosis.
-
Non-alcoholic fatty liver disease (NAFLD): Insulin resistance drives hepatic lipogenesis, leading to fat accumulation in the liver.
-
Polycystic ovary syndrome (PCOS): Insulin resistance is a core driver of PCOS, contributing to hormonal imbalance, irregular cycles, and infertility.
-
Cognitive decline: Insulin resistance in the brain, sometimes called “type 3 diabetes”, is linked to Alzheimer’s disease and accelerated cognitive aging.
-
Cancer risk: Hyperinsulinemia promotes cell proliferation and inhibits apoptosis. Elevated insulin is associated with increased risk of colorectal, breast, and pancreatic cancers.
The Takeaway
Insulin resistance is arguably the most important metabolic condition you have never been tested for. It underlies or contributes to nearly every chronic disease of modern life, diabetes, heart disease, fatty liver, PCOS, cognitive decline, and certain cancers. And it is reversible, especially when caught early.
The conventional approach of waiting for fasting glucose to become abnormal misses years of treatable metabolic dysfunction. Fasting insulin, HOMA-IR, and the triglyceride-to-HDL ratio can catch the problem at a stage where lifestyle intervention alone is often sufficient. Test early, test comprehensively, and act on the data. Your biology is unique, and the numbers are always worth knowing.
Frequently Asked Questions
Can you have insulin resistance with normal blood sugar?
Yes. Fasting glucose can remain in the normal range for years while insulin resistance develops silently. This happens because the pancreas compensates by producing increasingly higher levels of insulin to keep glucose controlled. A person may have been insulin resistant for 5 to 15 years before fasting glucose begins to rise. This is why measuring fasting insulin, not just glucose, is important for early detection.
What are the early warning signs of insulin resistance?
Common signs may include central weight gain (especially around the midsection), energy crashes or brain fog after carbohydrate-heavy meals, persistent sugar cravings, and difficulty losing weight despite caloric restriction. Skin-related changes such as acanthosis nigricans (dark, velvety patches on the neck, armpits, or groin) and multiple skin tags can also be associated with insulin resistance. Elevated blood pressure and an abnormal lipid profile with high triglycerides and low HDL may further suggest the condition.
What is the best test to detect insulin resistance early?
Fasting insulin is considered the most direct early marker. A fasting insulin level above 8 µIU/mL may suggest early resistance, while levels above 12 µIU/mL can indicate more significant dysfunction. Standard annual physicals often check only fasting glucose and HbA1c, which may not reveal the problem until it has progressed to prediabetes or type 2 diabetes. Including fasting insulin in a metabolic assessment can help identify resistance years earlier.
Why is insulin resistance so hard to catch with routine blood work?
Routine blood work typically relies on fasting glucose to assess metabolic health. In the early stages of insulin resistance, glucose levels can appear normal because the pancreas is overproducing insulin to compensate. The glucose stays controlled, so the results look fine on paper. The underlying problem, hyperinsulinemia, goes undetected unless insulin itself is measured. By the time glucose rises enough to flag as prediabetes, significant metabolic damage to blood vessels, the liver, and hormonal systems may have already occurred.
Related Articles
Resources
-
Petersen MC, Shulman GI. Mechanisms of Insulin Action and Insulin Resistance. Physiol Rev. 2018;98(4):2133-2223. PMID: 30067154
-
Kraft JR. Detection of Diabetes Mellitus In Situ (Occult Diabetes). Lab Med. 1975;6(2):10-22. doi:10.1093/labmed/6.2.10
-
Shulman GI. Ectopic fat in insulin resistance, dyslipidemia, and cardiometabolic disease. N Engl J Med. 2014;371(12):1131-1141. PMID: 25229917
-
Donga E, van Dijk M, van Dijk JG, et al. A single night of partial sleep deprivation induces insulin resistance in multiple metabolic pathways in healthy subjects. J Clin Endocrinol Metab. 2010;95(6):2963-2968. PMID: 20371664
-
Bird SR, Hawley JA. Update on the effects of physical activity on insulin sensitivity in humans. BMJ Open Sport Exerc Med. 2016;2(1):e000143. PMID: 28879026